Using following command line, from <CMD> in Windows, with one of latest versions ezCon, ezCon241021a.py, in ezRA suite of software, https://github.com/tedcline/ezRA
py ../ezRA/ezCon241021a.py data -ezConAntXTFreqBinsFracL 0 1 -ezConUseVlsr 0 -ezConAntXTVTFreqBinsFracL 0 1 -ezConPlotRangeL 87 87 -ezCon087Csv 1
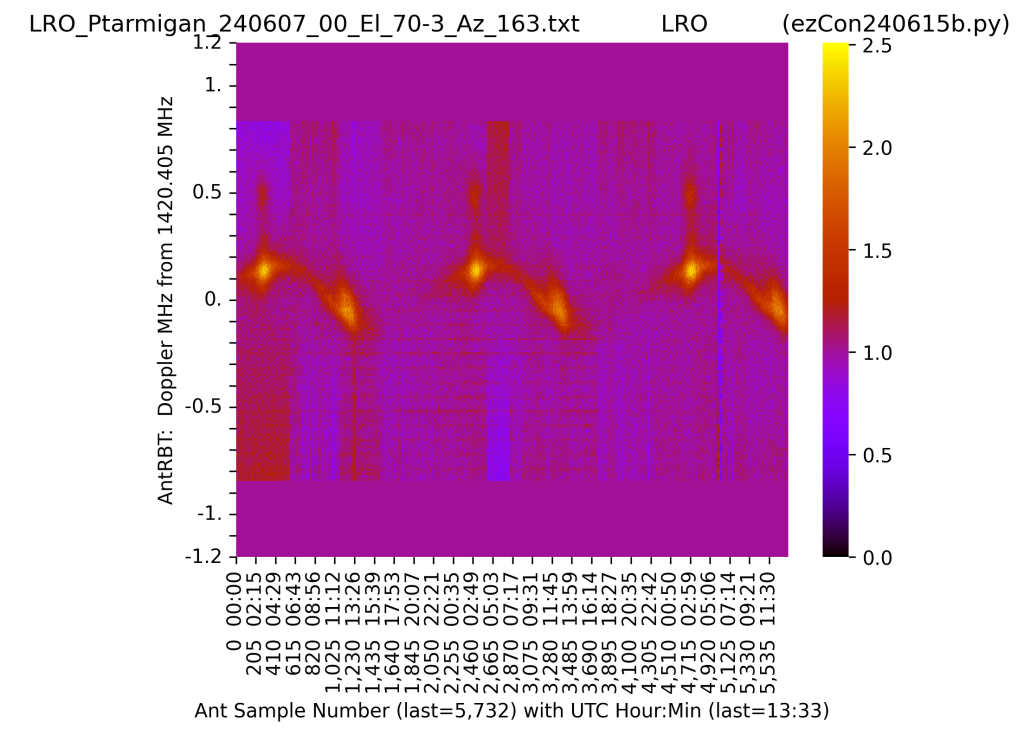
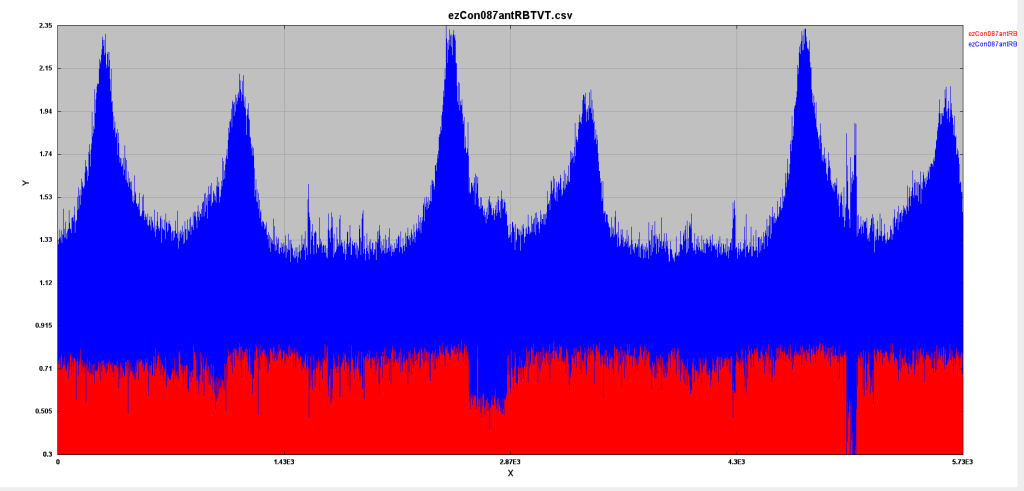
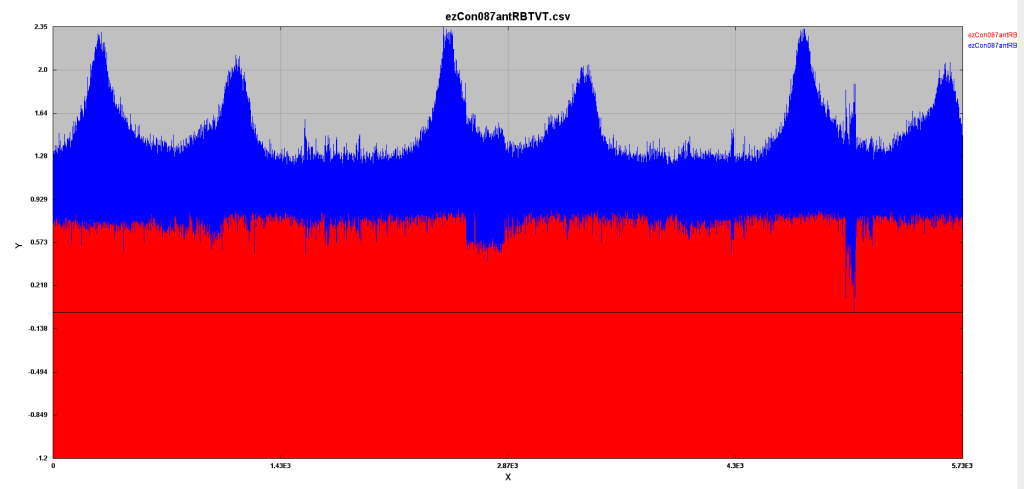
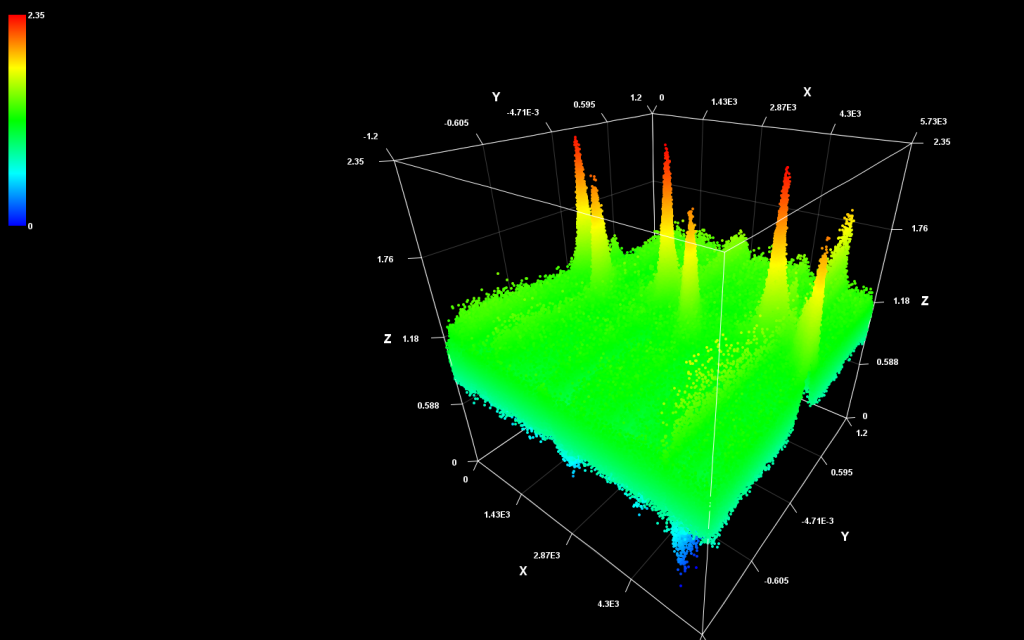
This produces a single combined CSV data file compatible with Rinearn3d software called ezCon087antRBTVT.csv
I have found it is best to use around 2 days of data only – large data sets are incompatible with Rinearn3D.
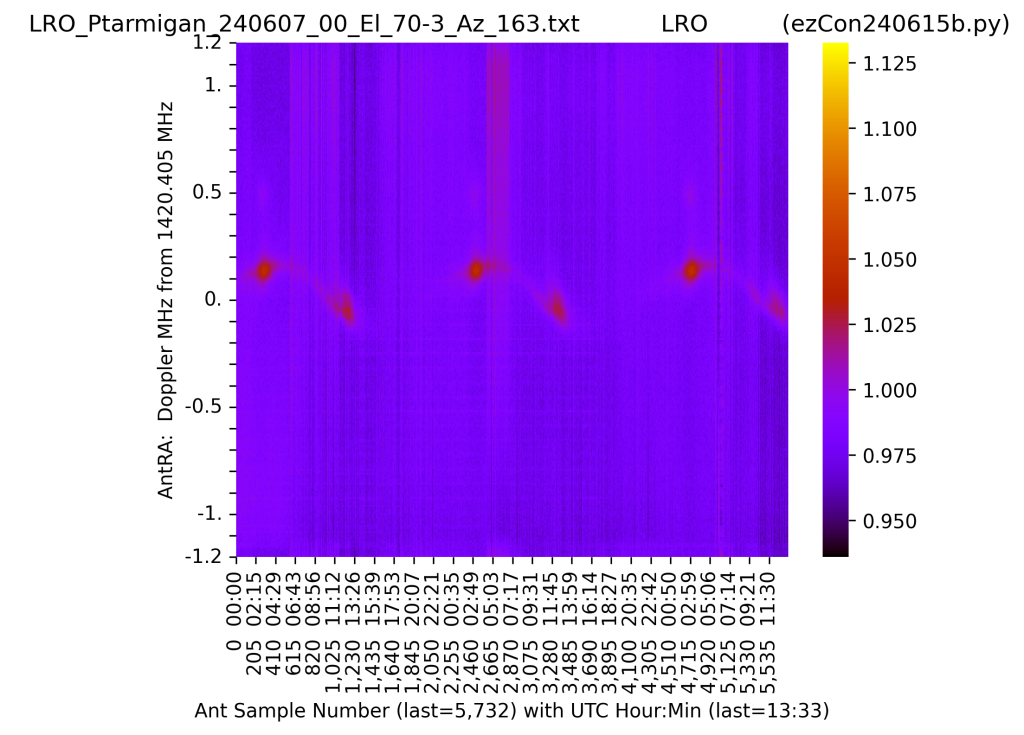
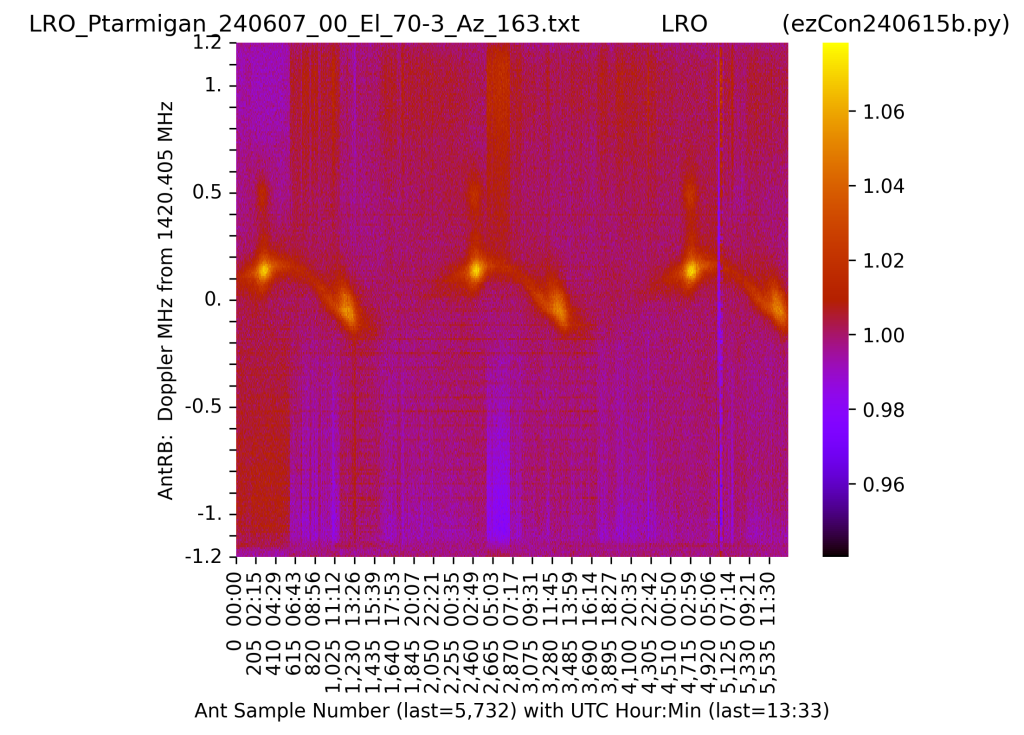
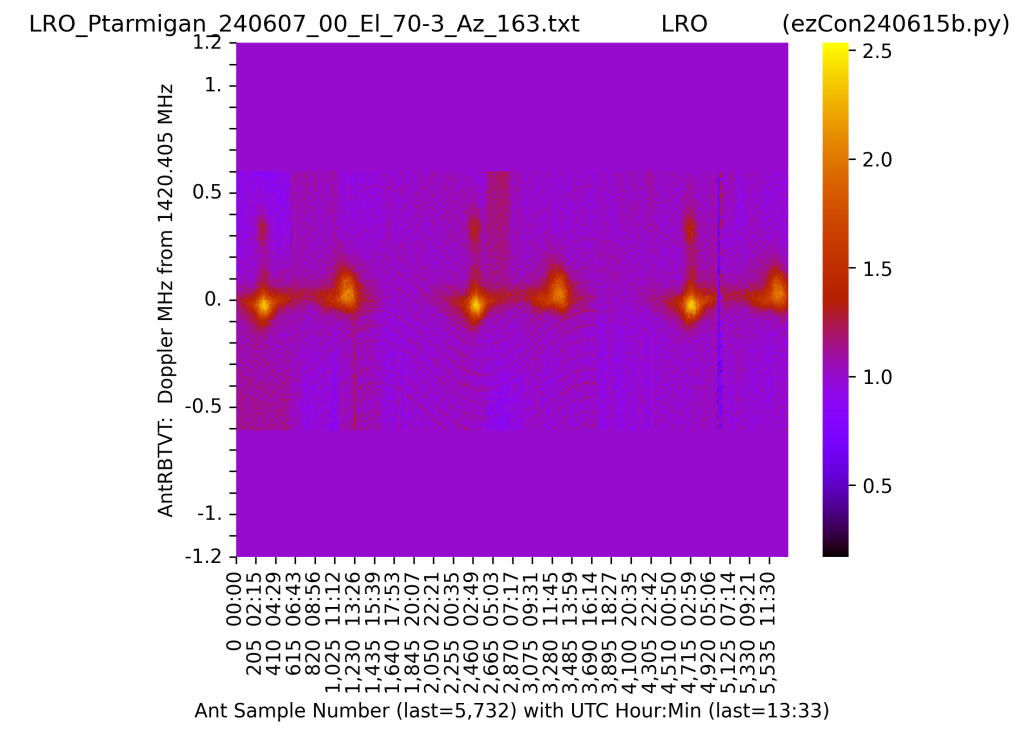
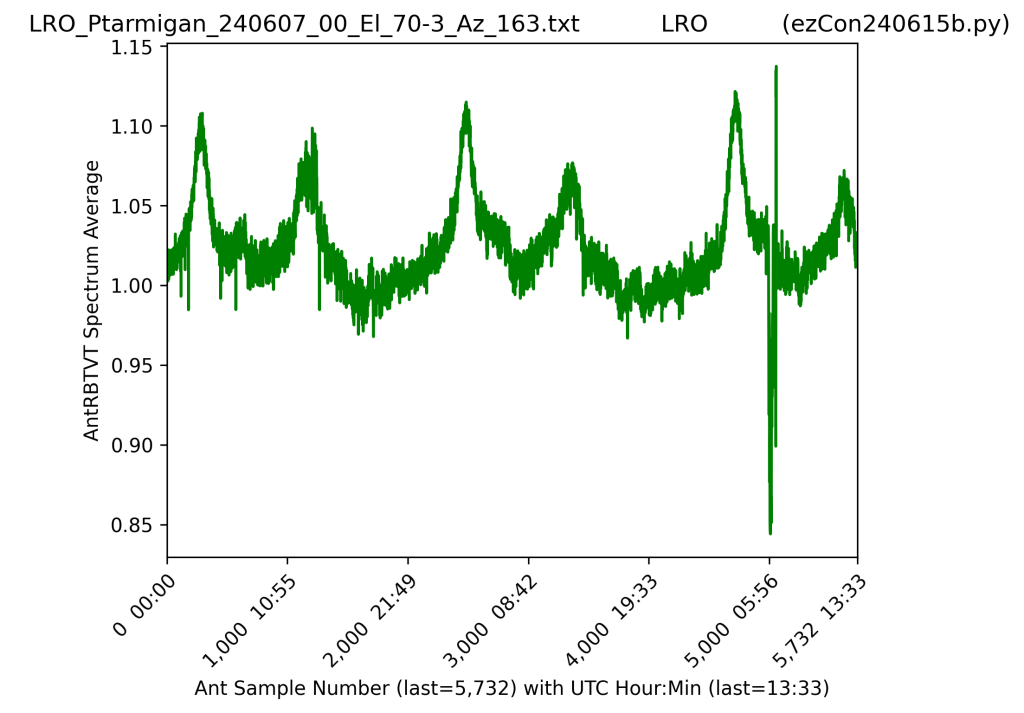
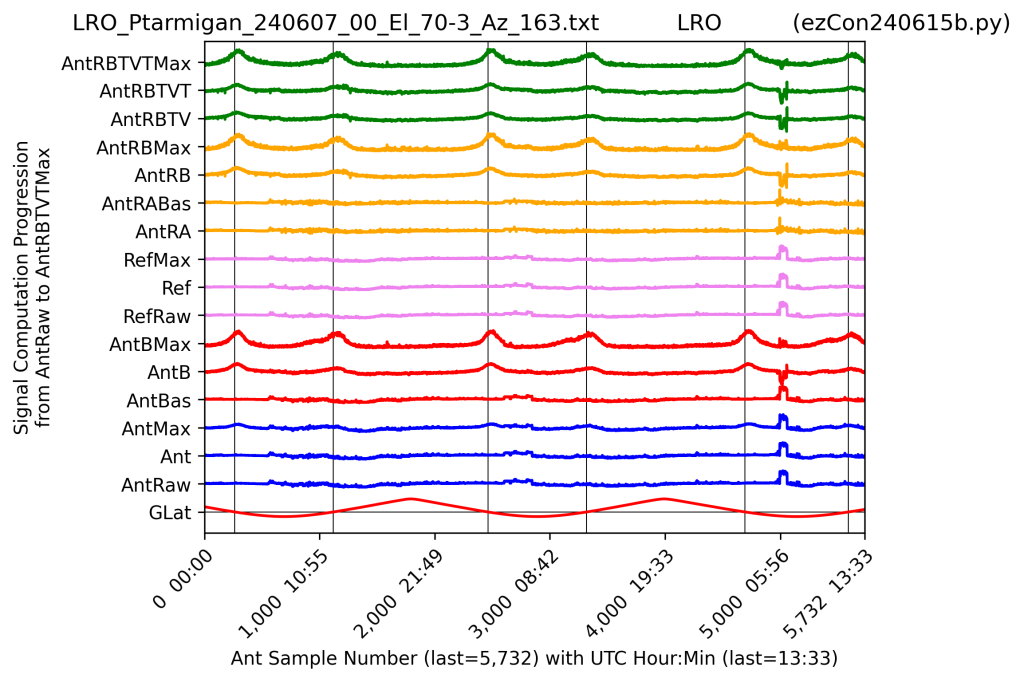
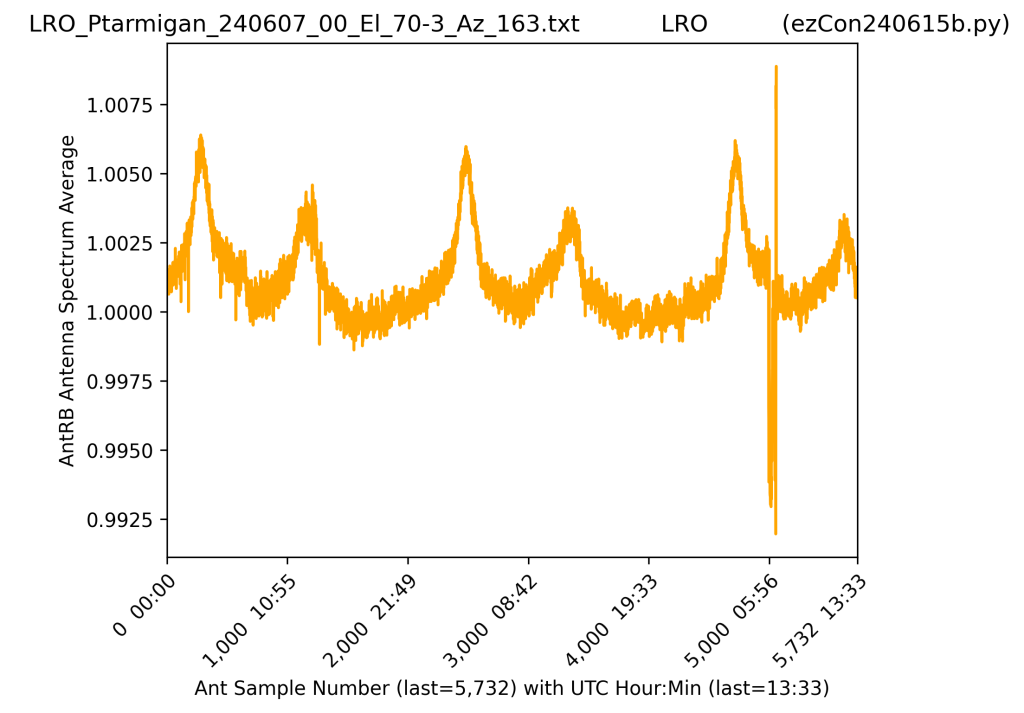
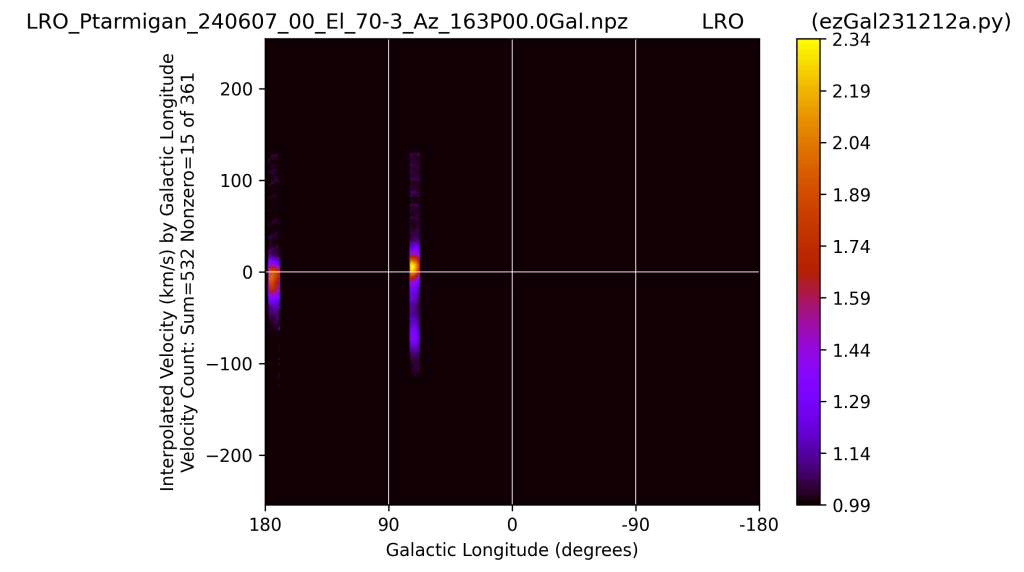
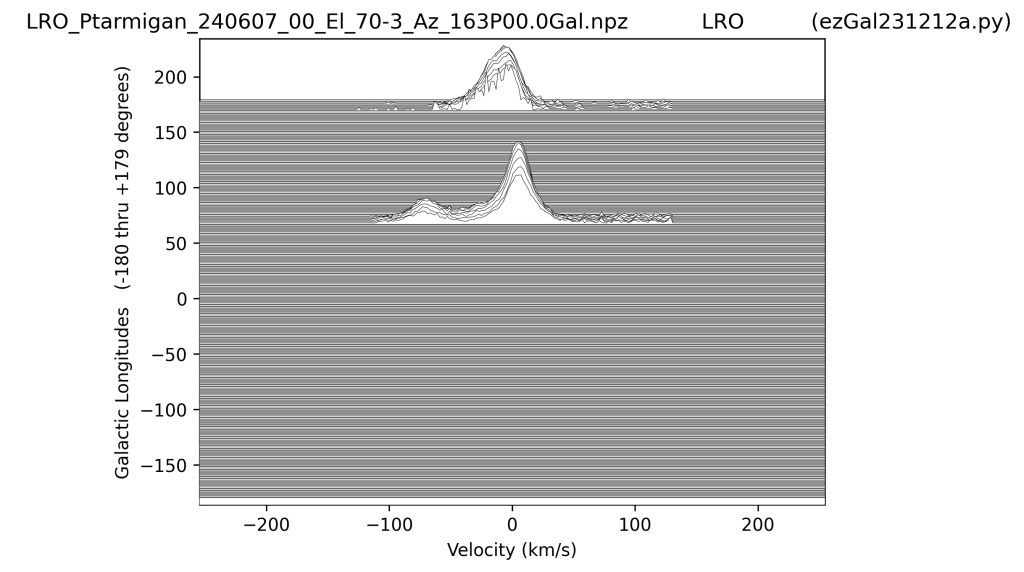
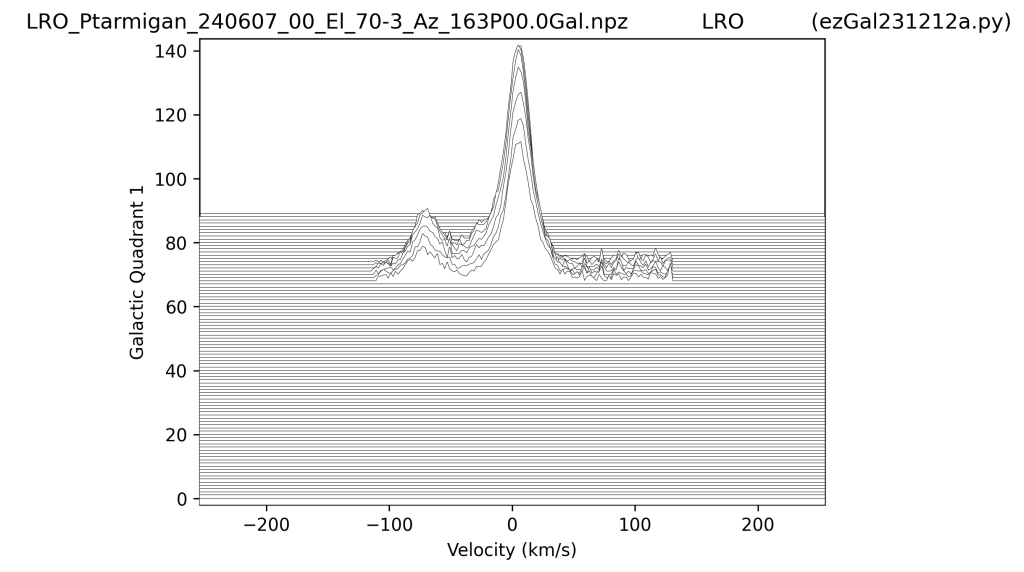
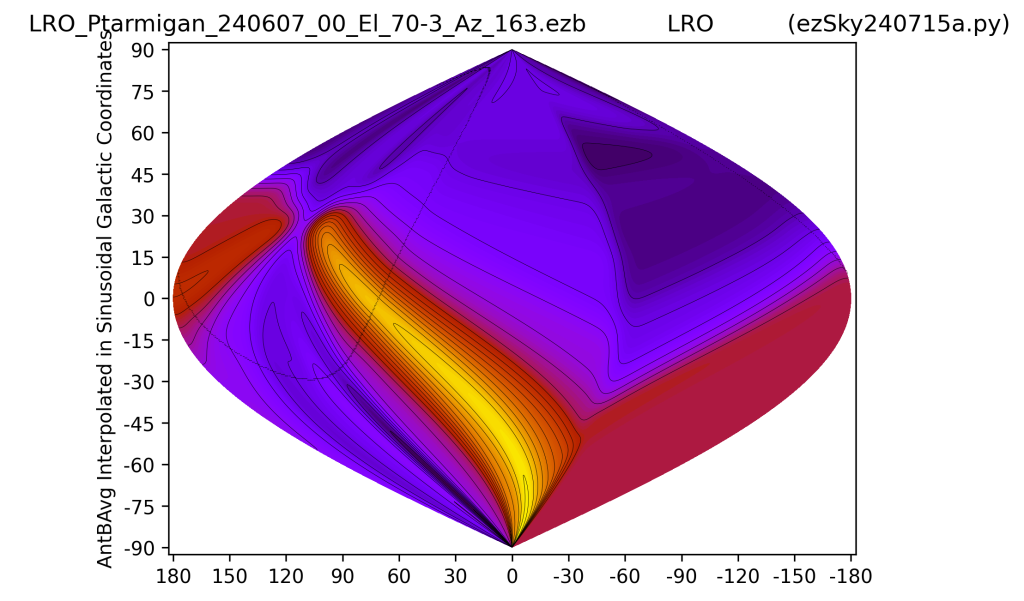
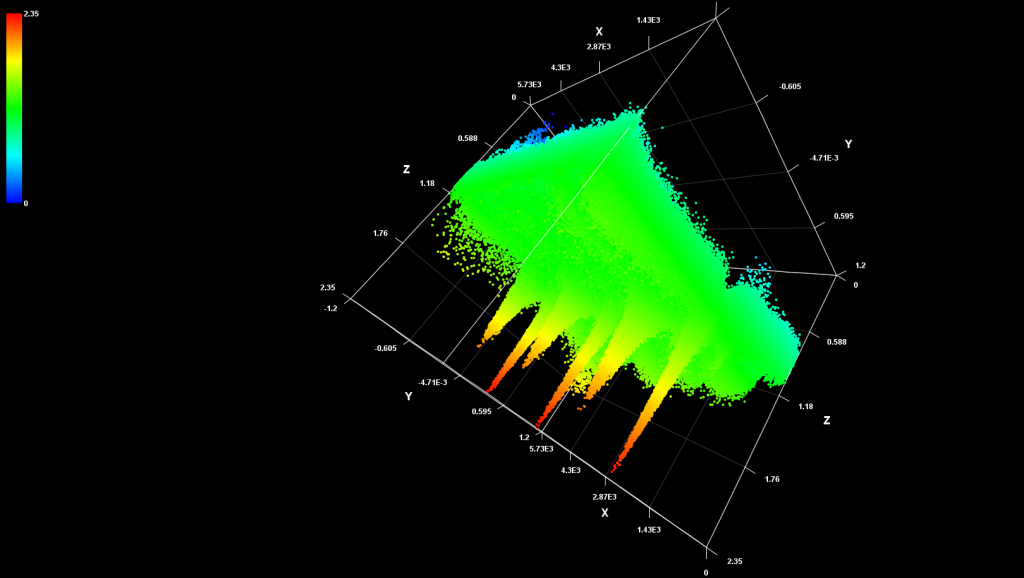
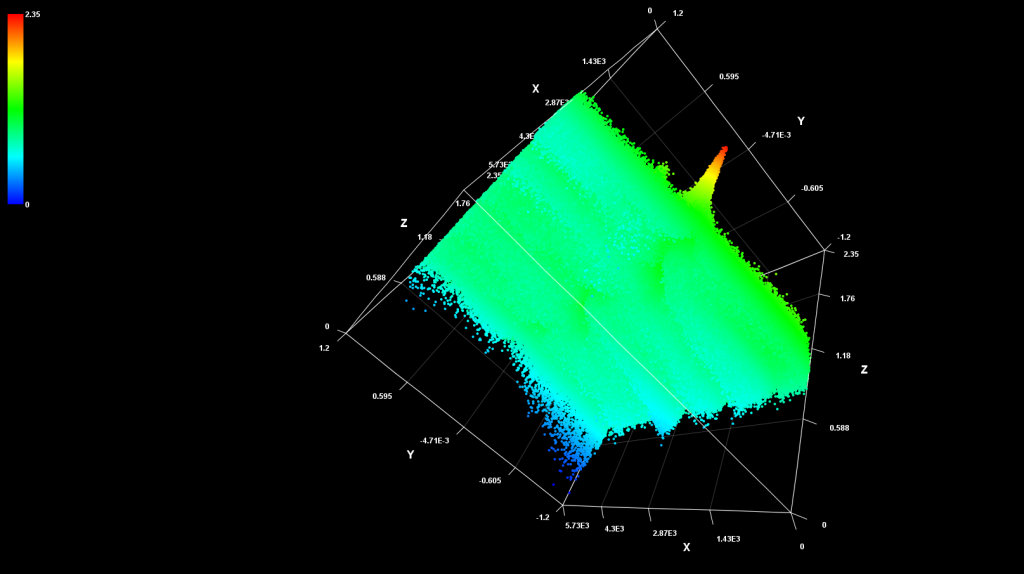
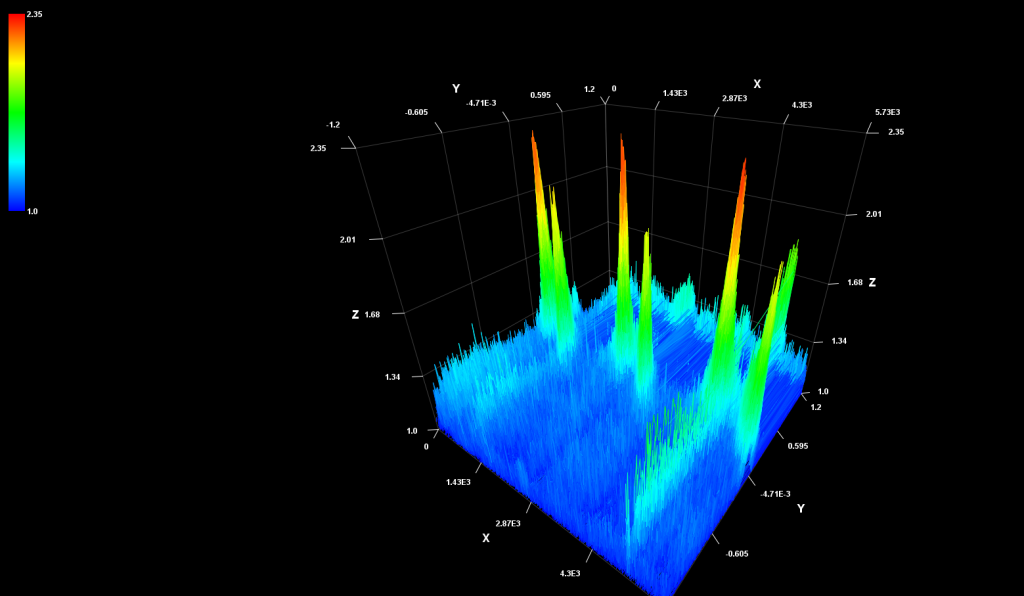
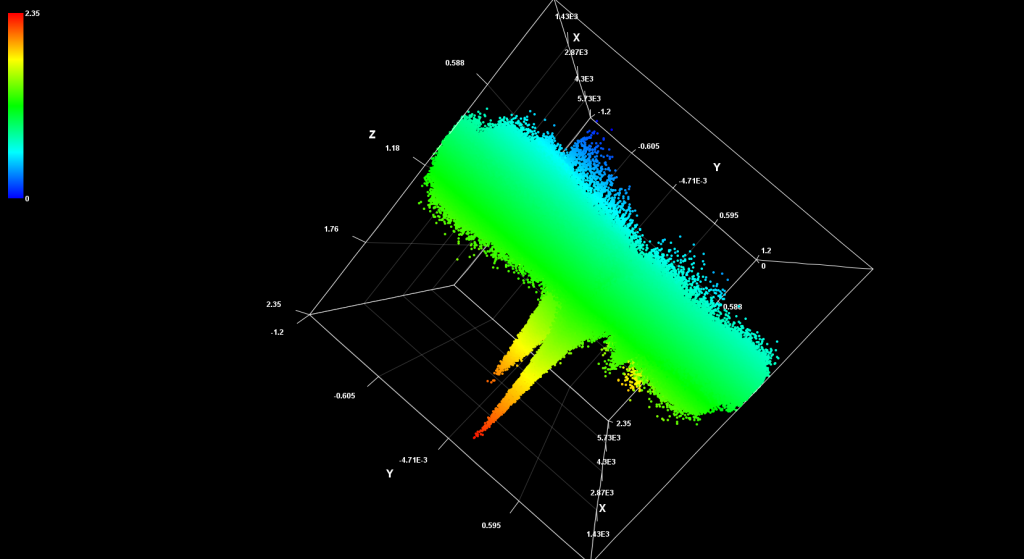
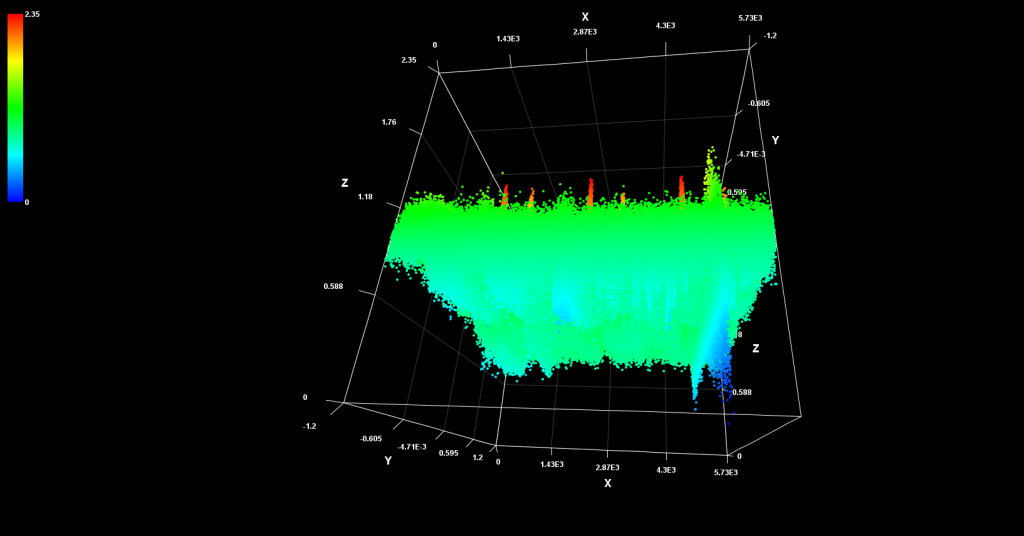
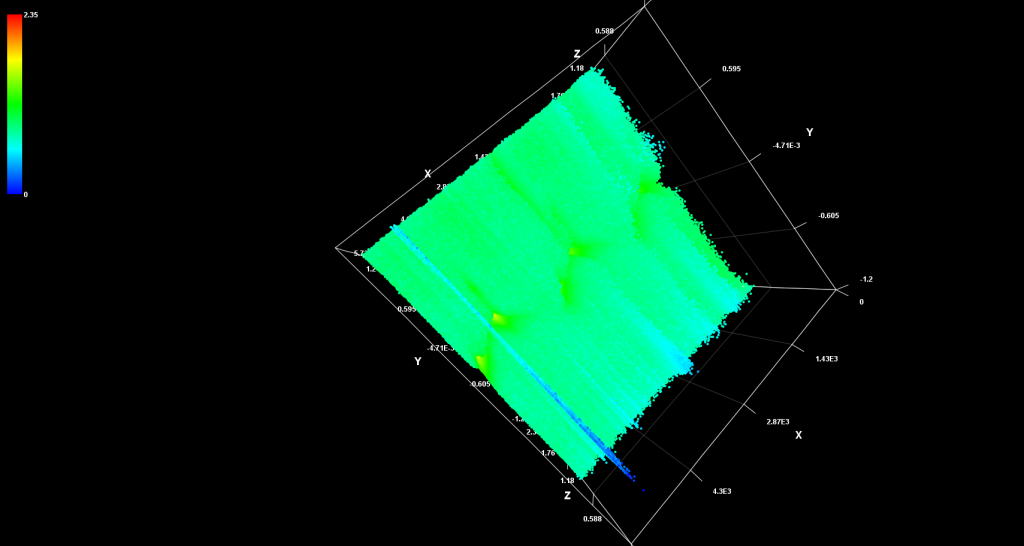
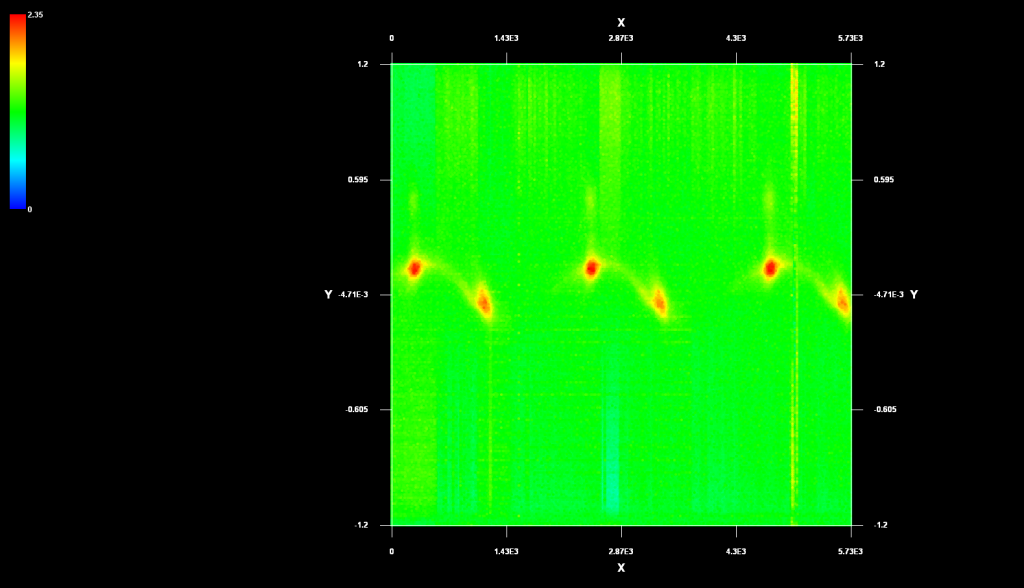
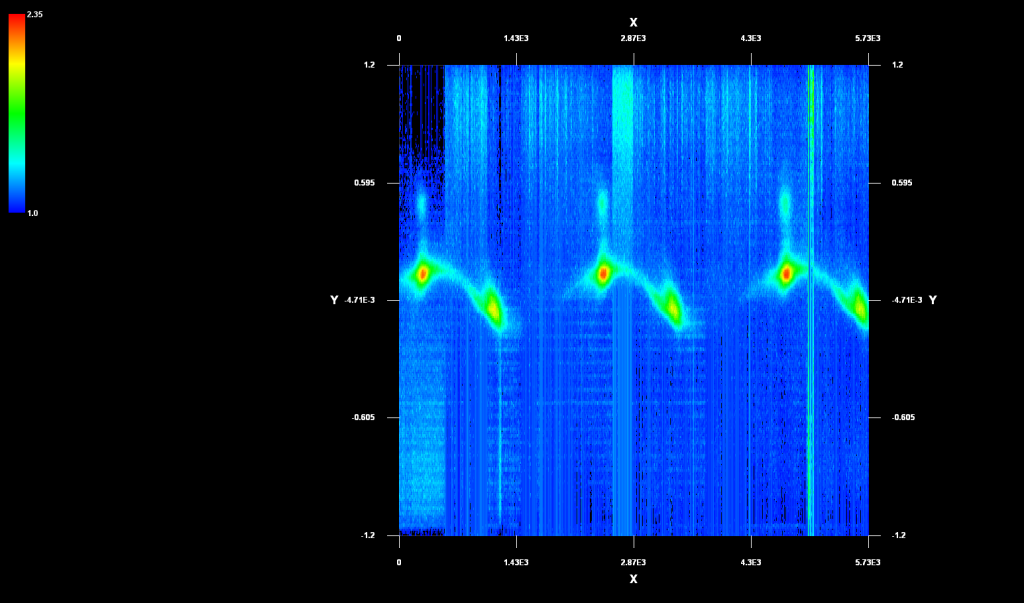
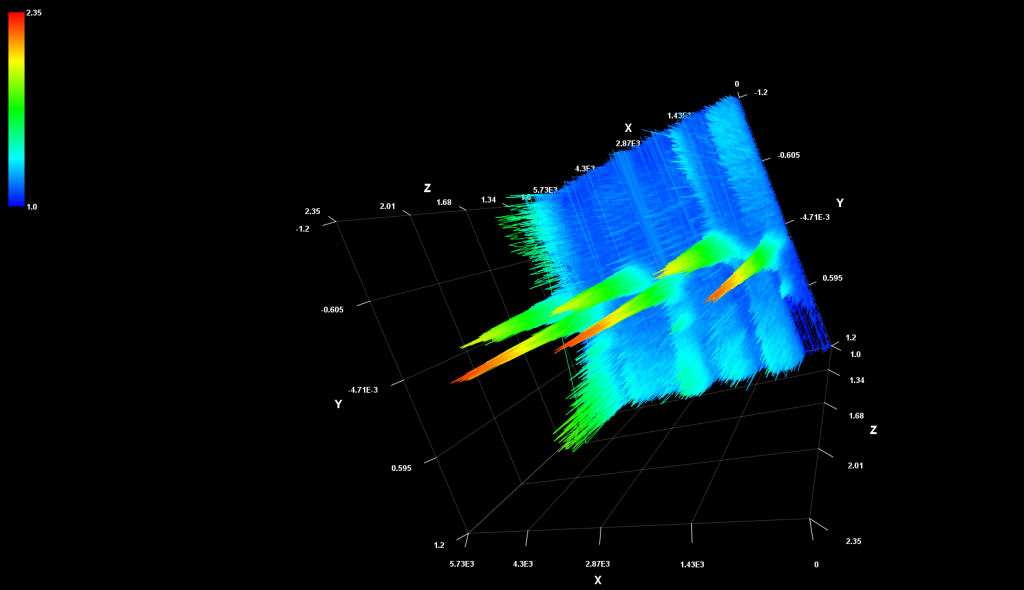
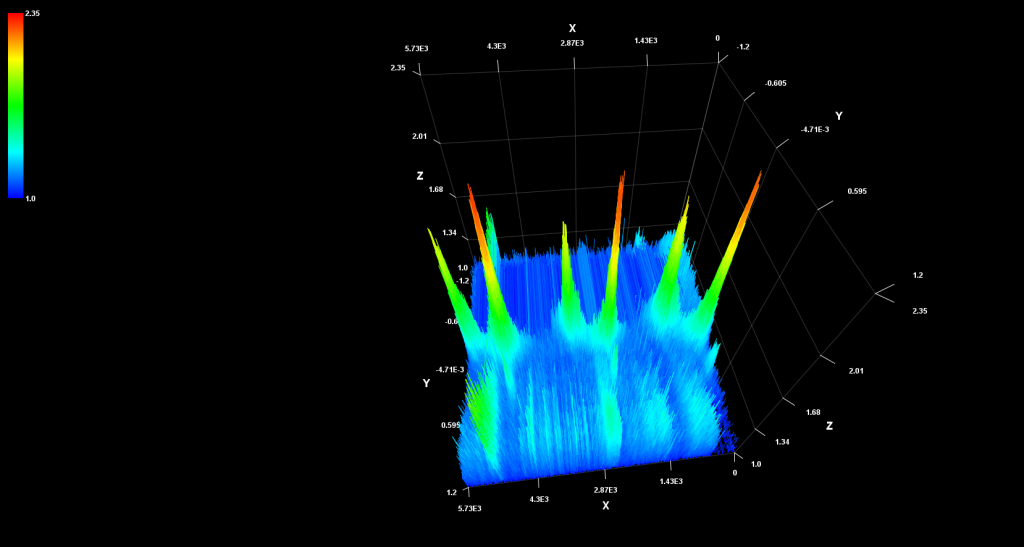
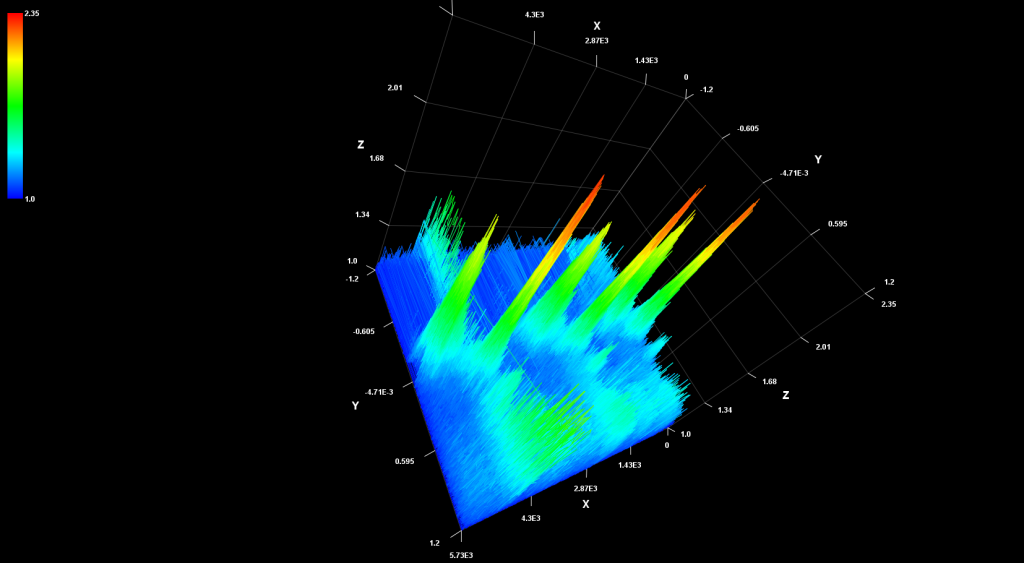
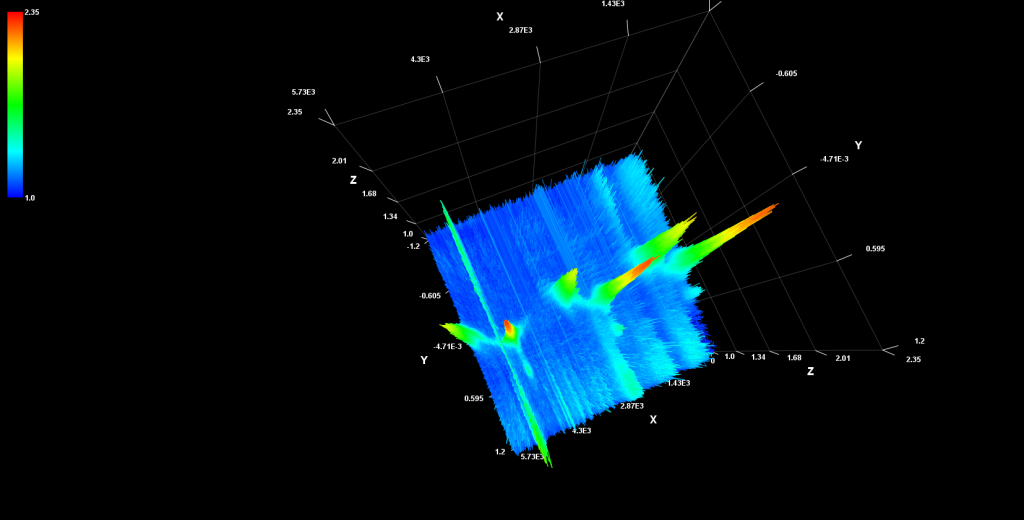
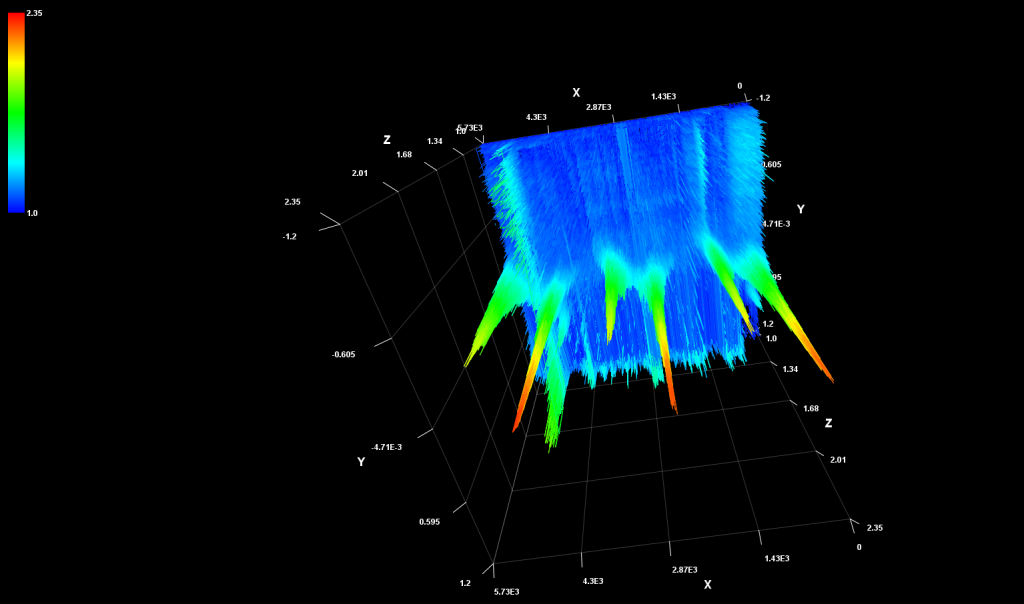
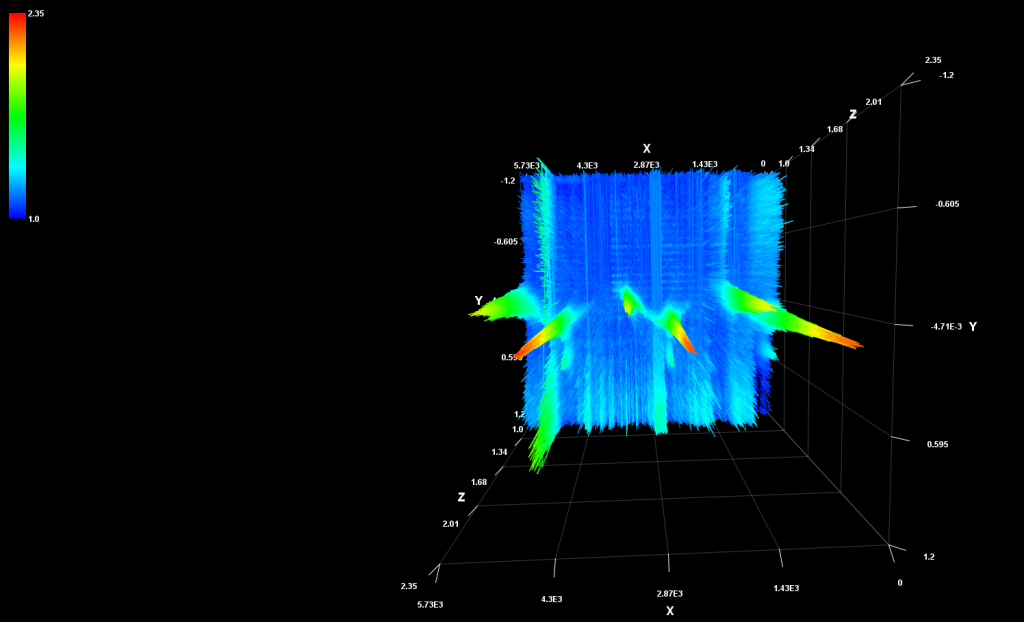
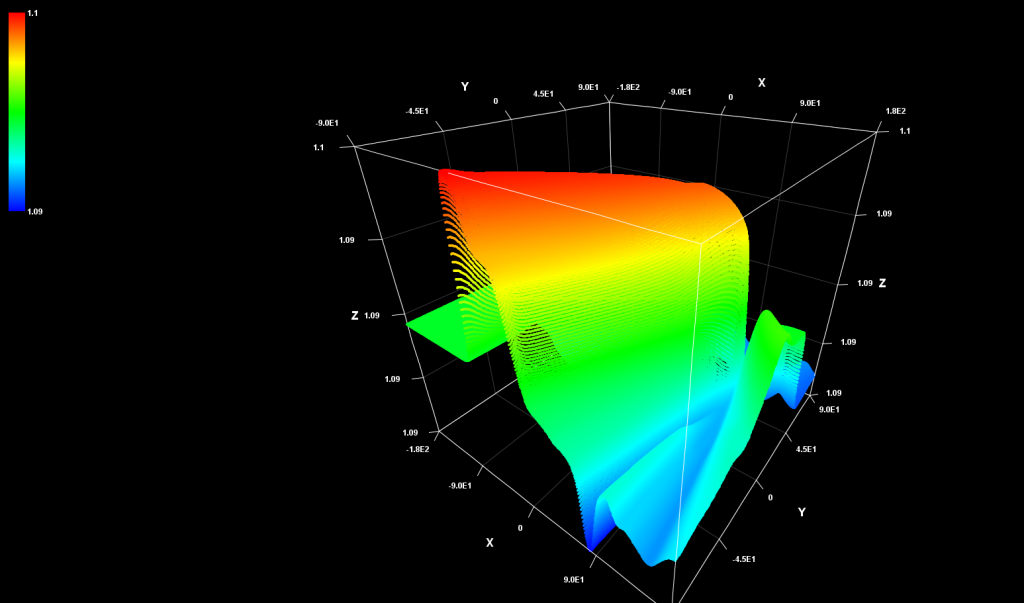
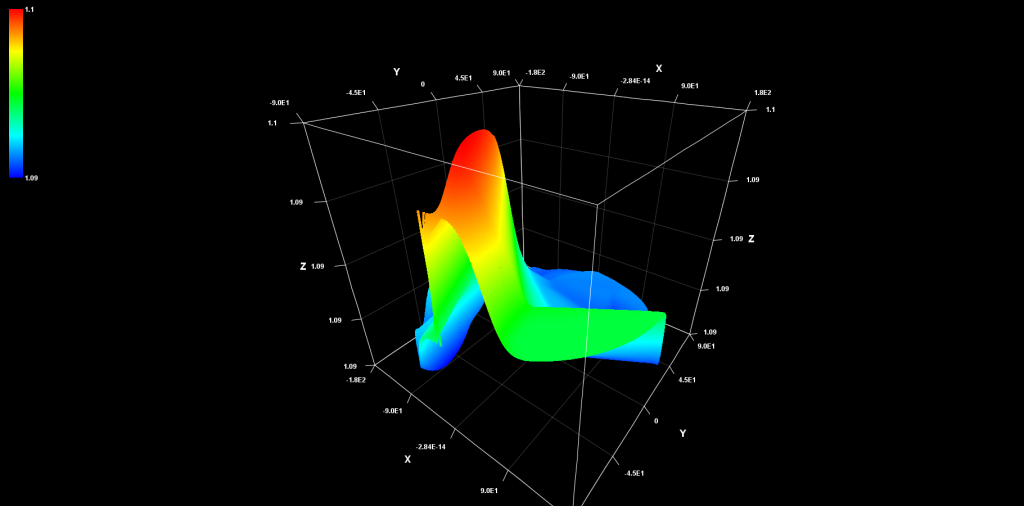
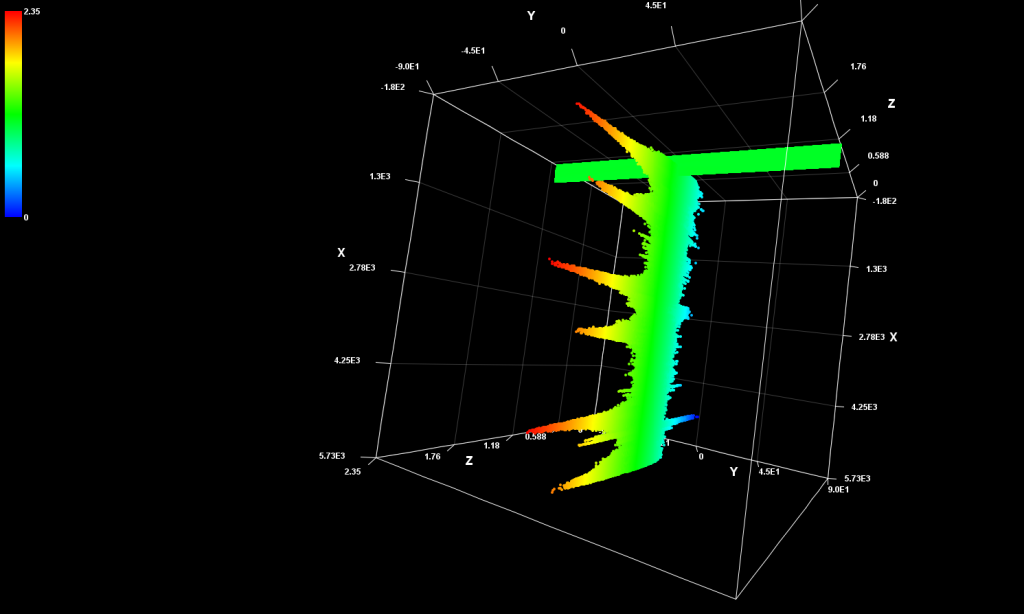
The Rinearn3D plots below show similar hydrogen line features to the 2D plots on Rinearn and on ezRA.
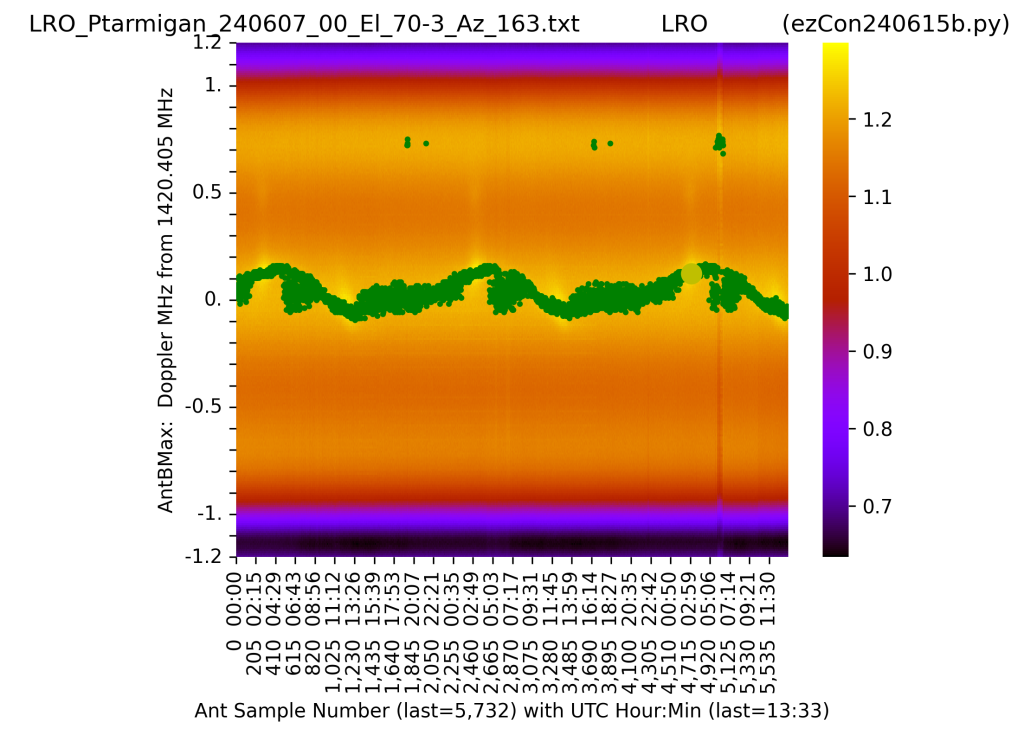
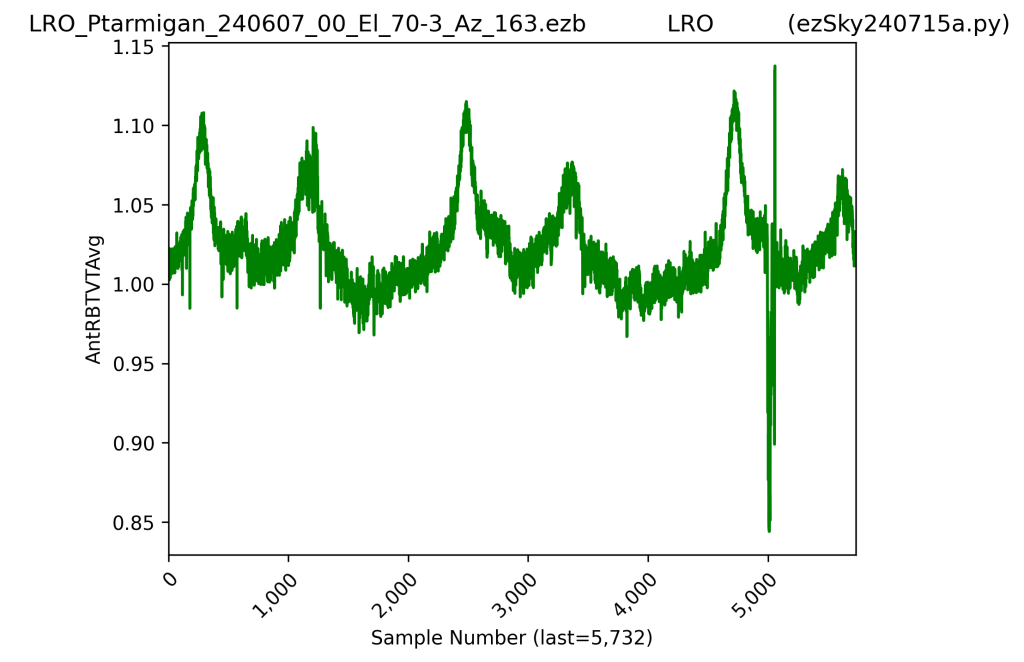
Output from Rinearn2D & Rinearn3D when I ran software on the 2 days of data from 6/6/2024-7/6/2024 from Ptarmigan 86x86cm ex-military dipole array:
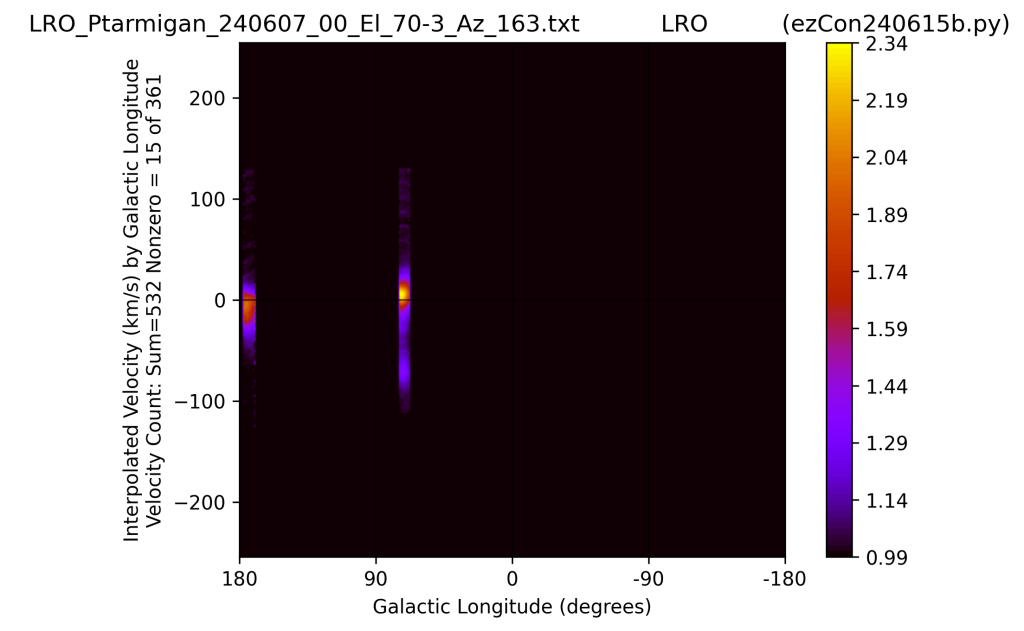
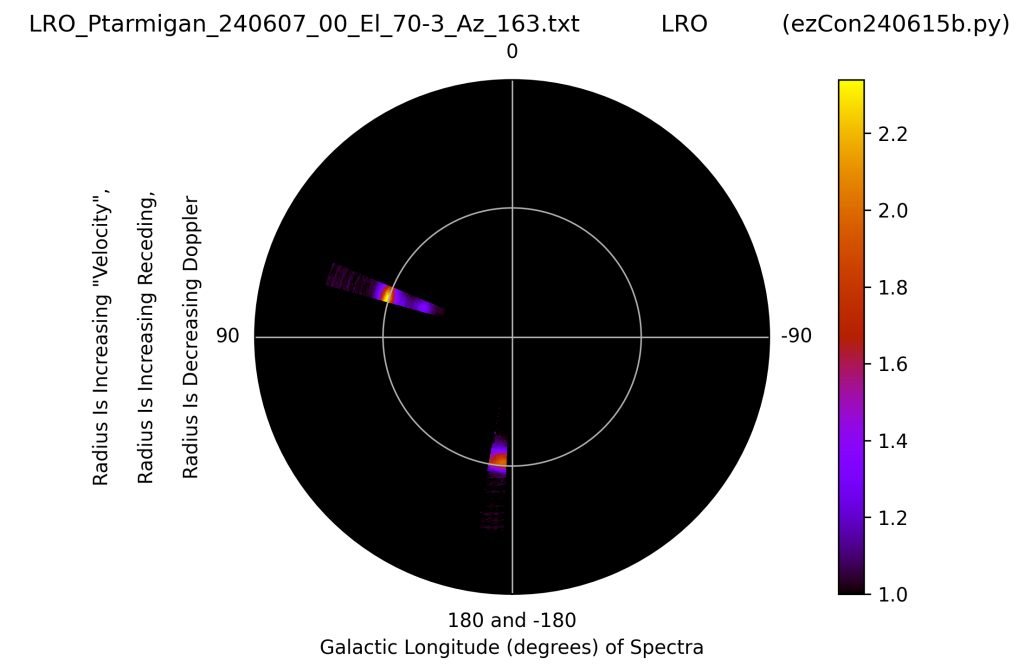
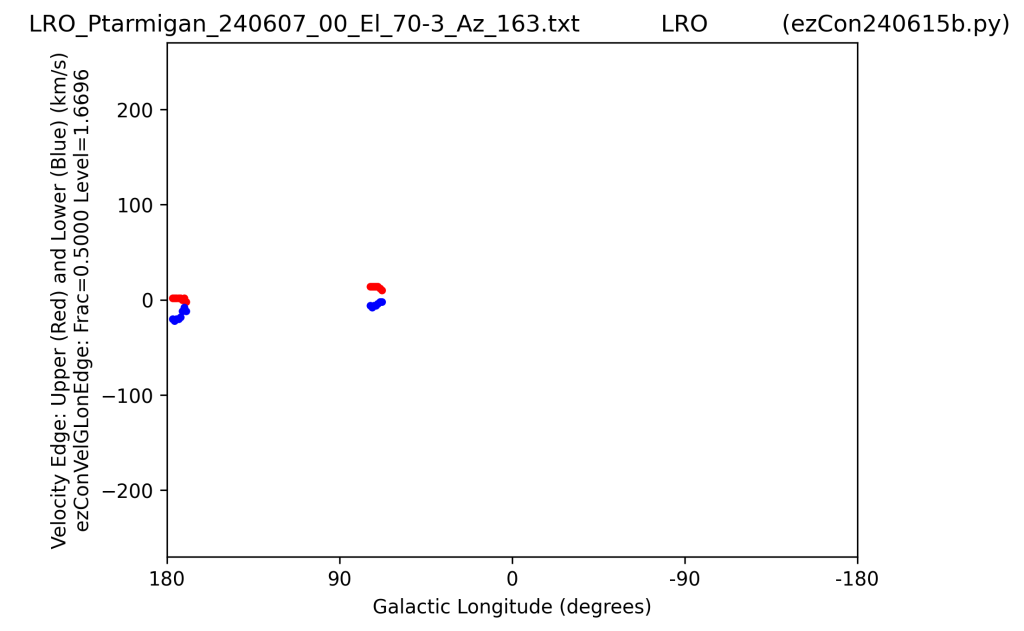
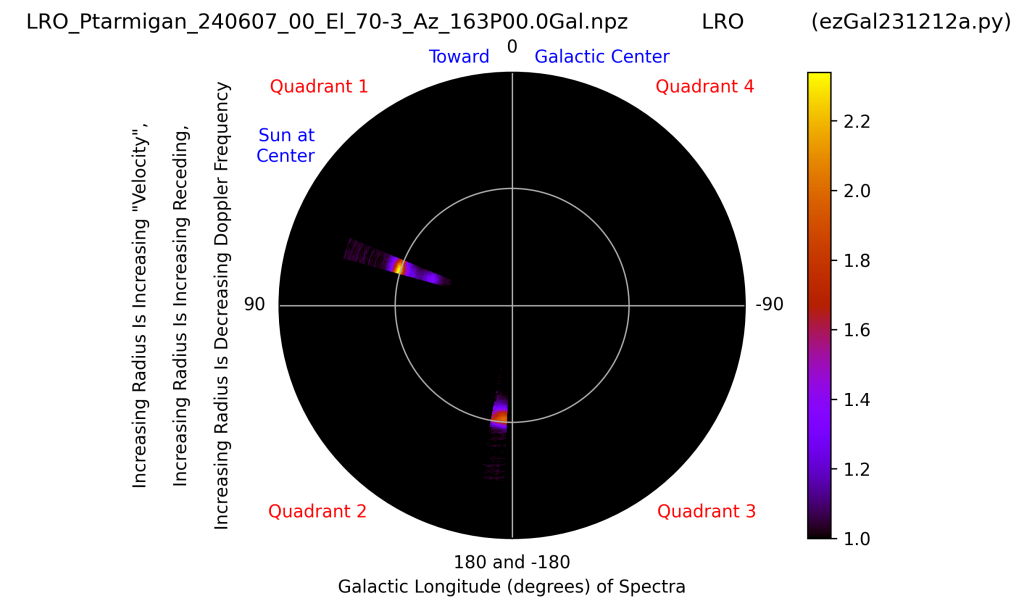
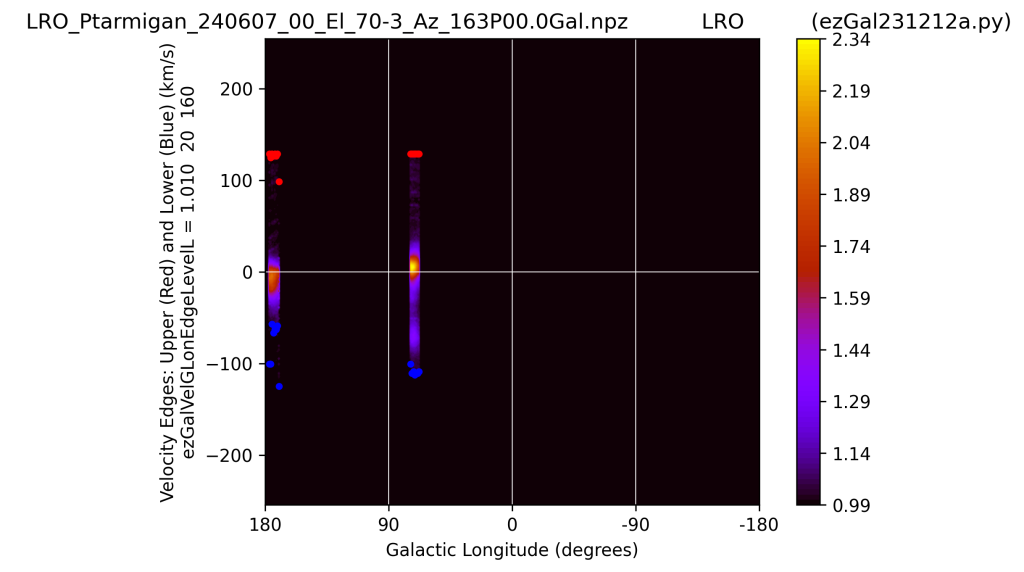
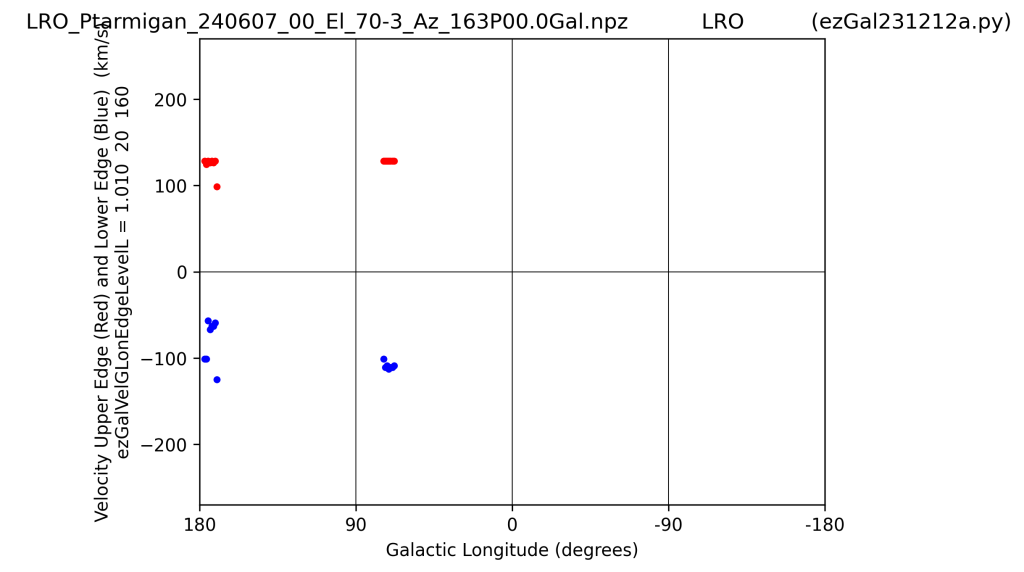
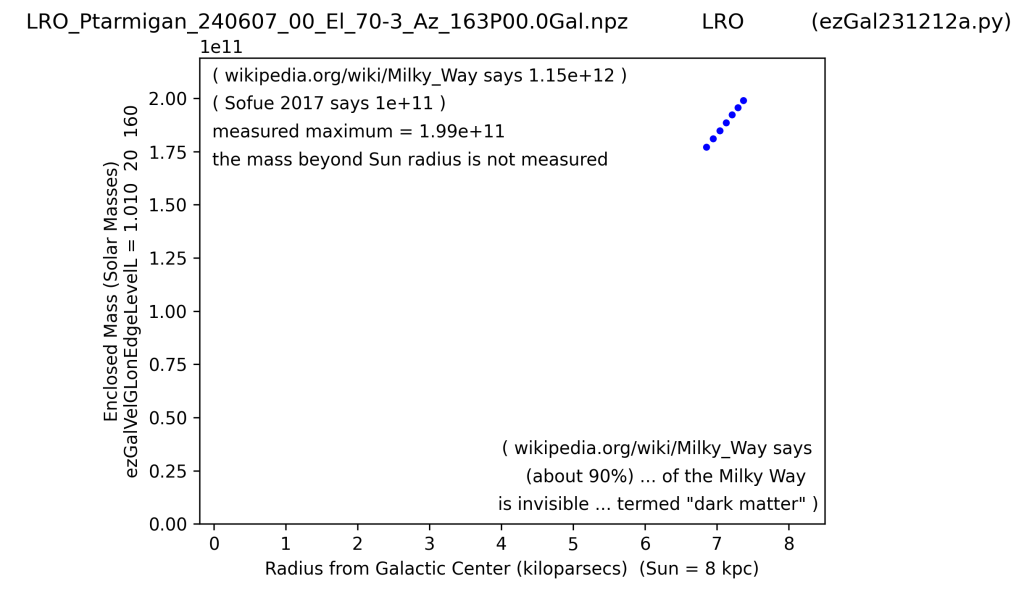
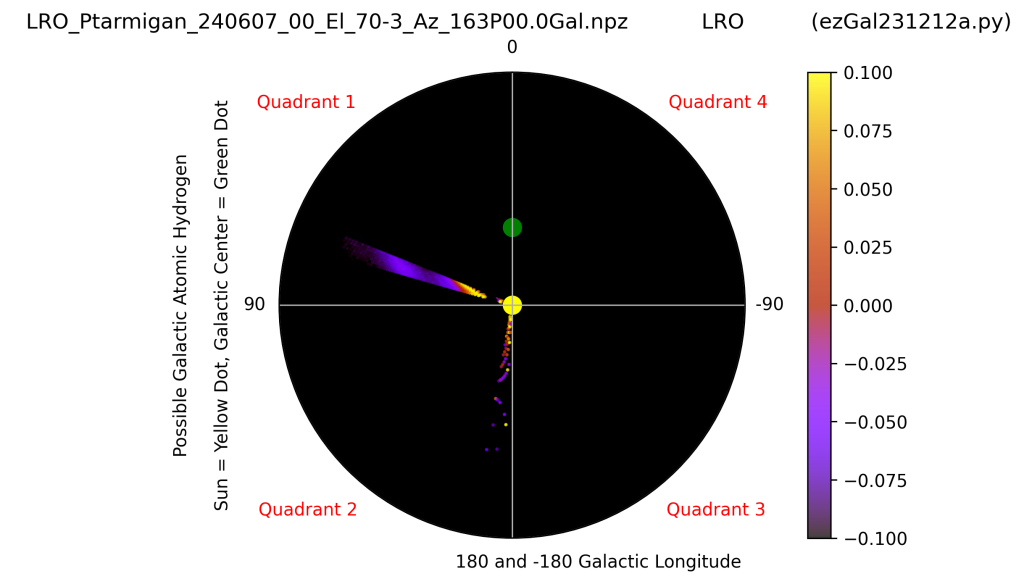
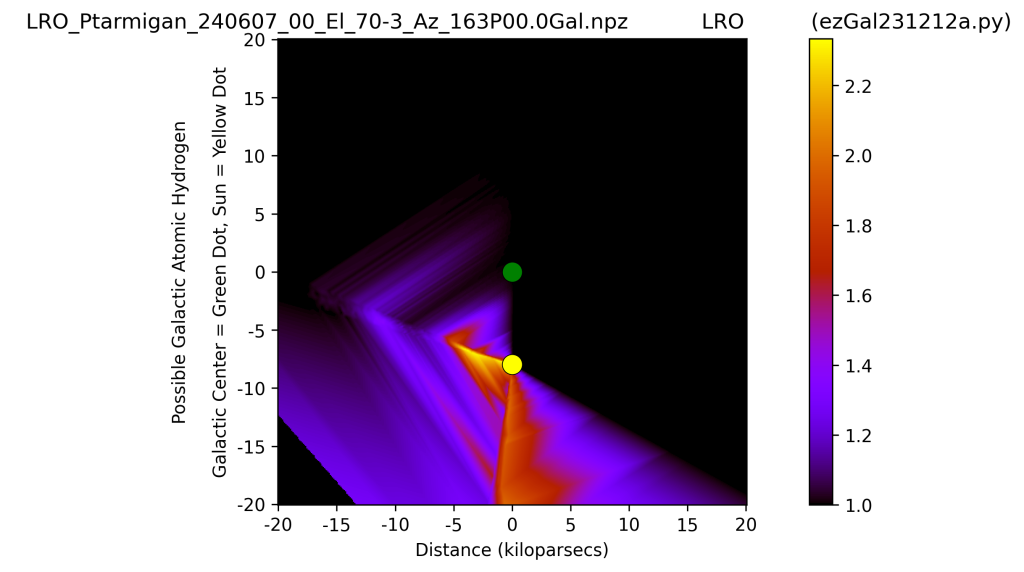
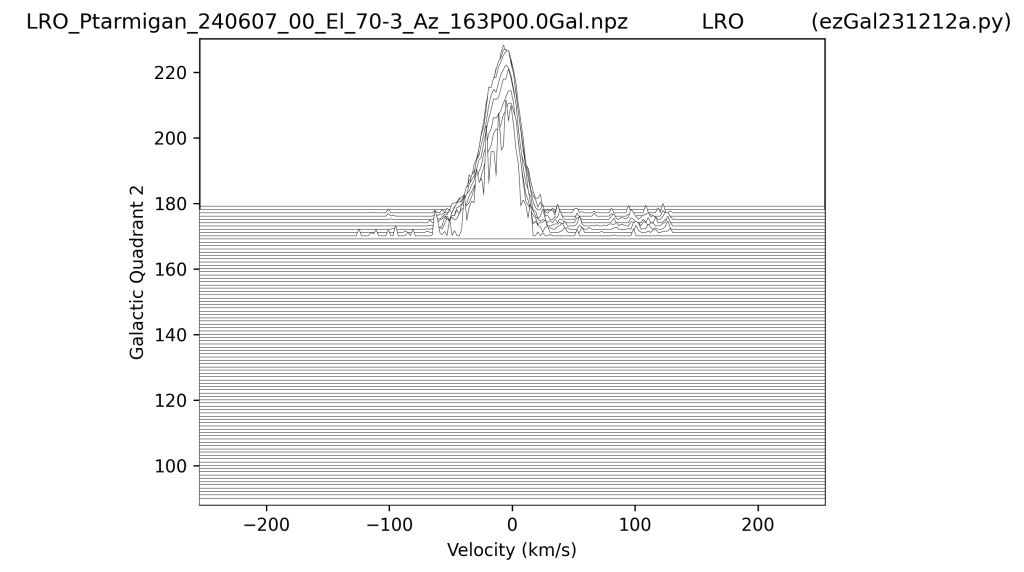
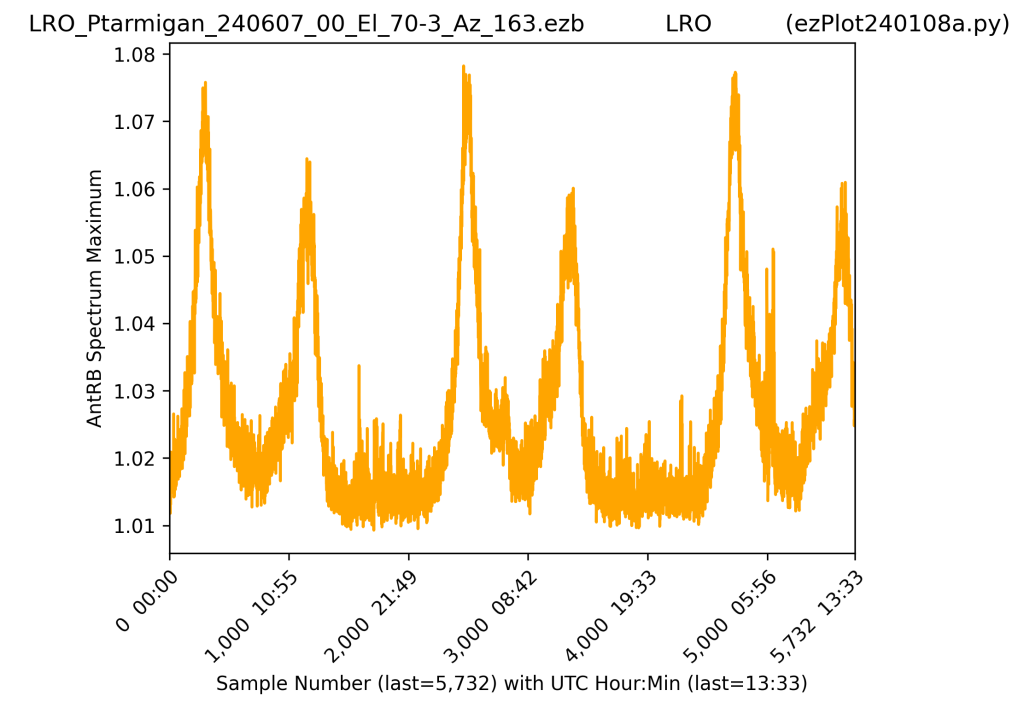
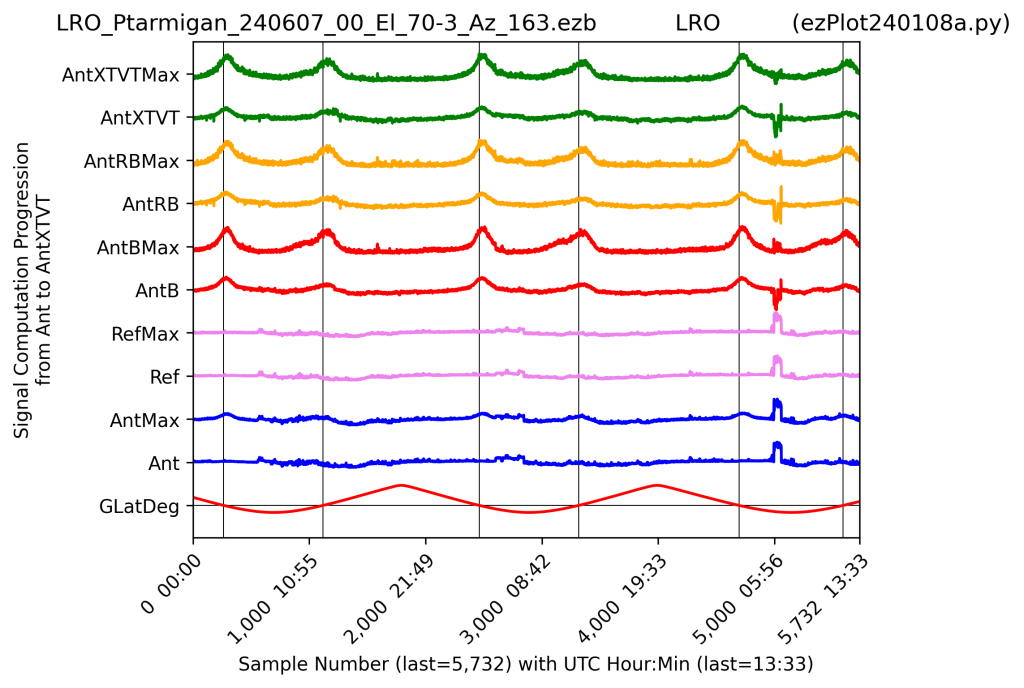
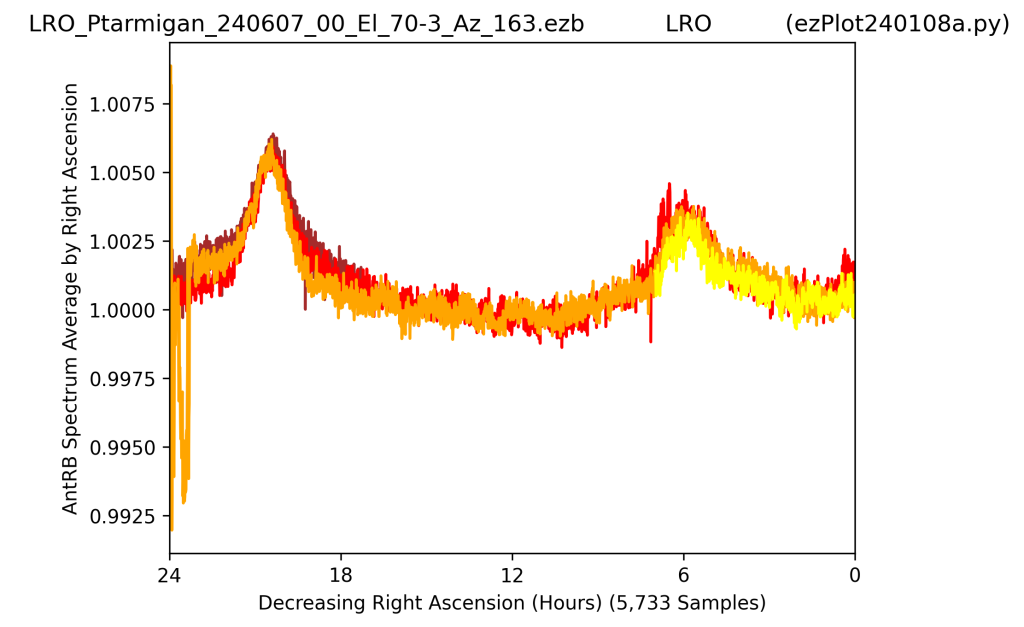
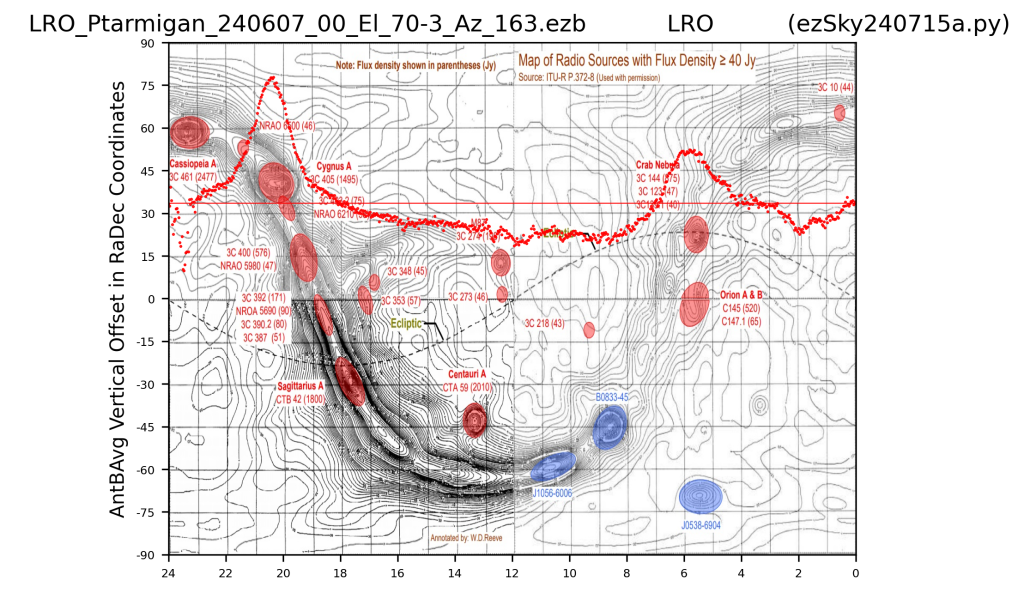
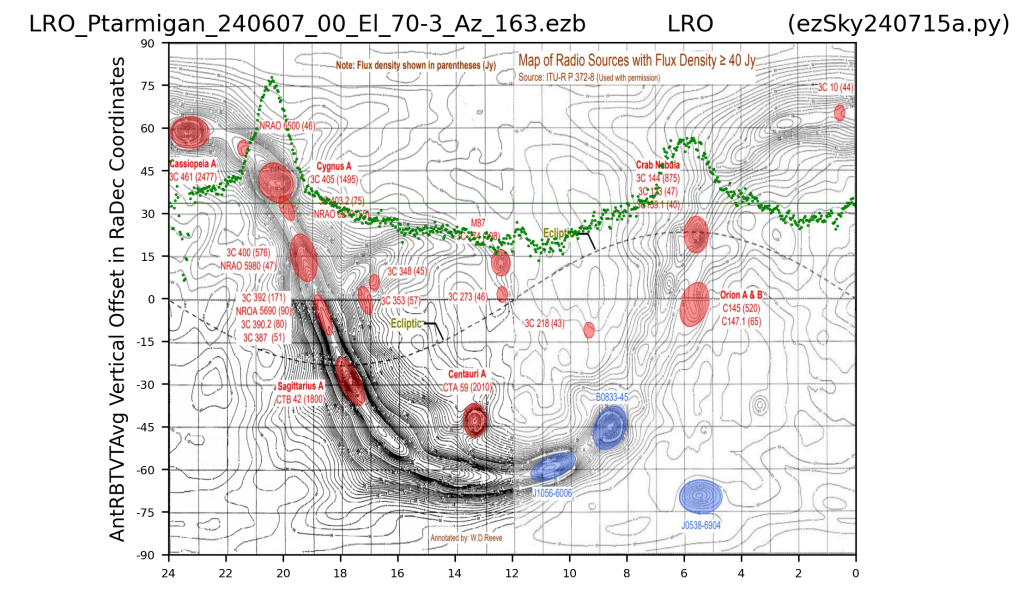
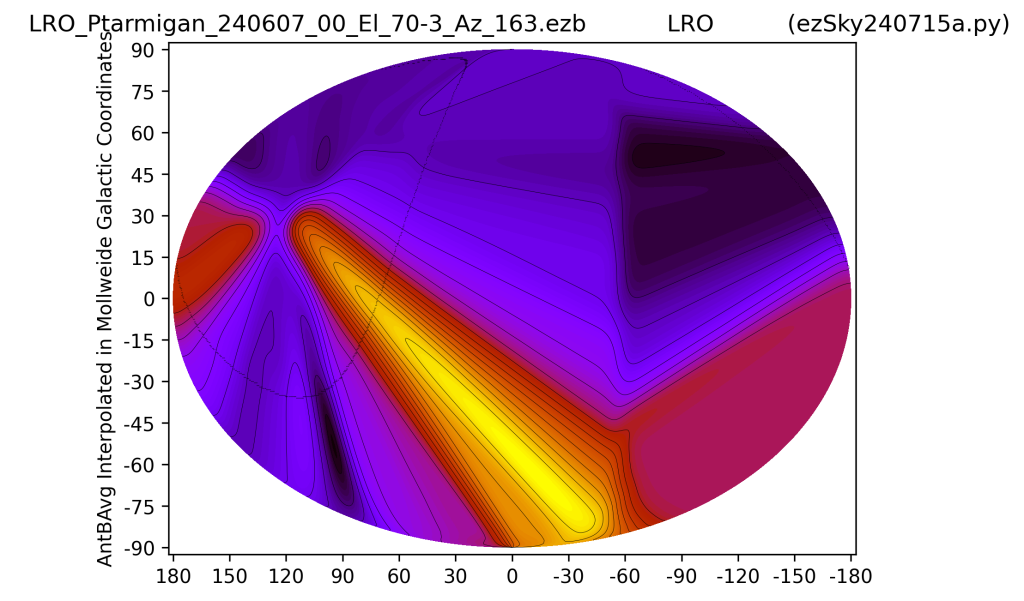
ezRA plots showing galactic location of the data used for this analysis and key analyses within ezRA: