Processing in ezRA+Rinearn3D Ptarmigan data several days (processed 071224@1300)
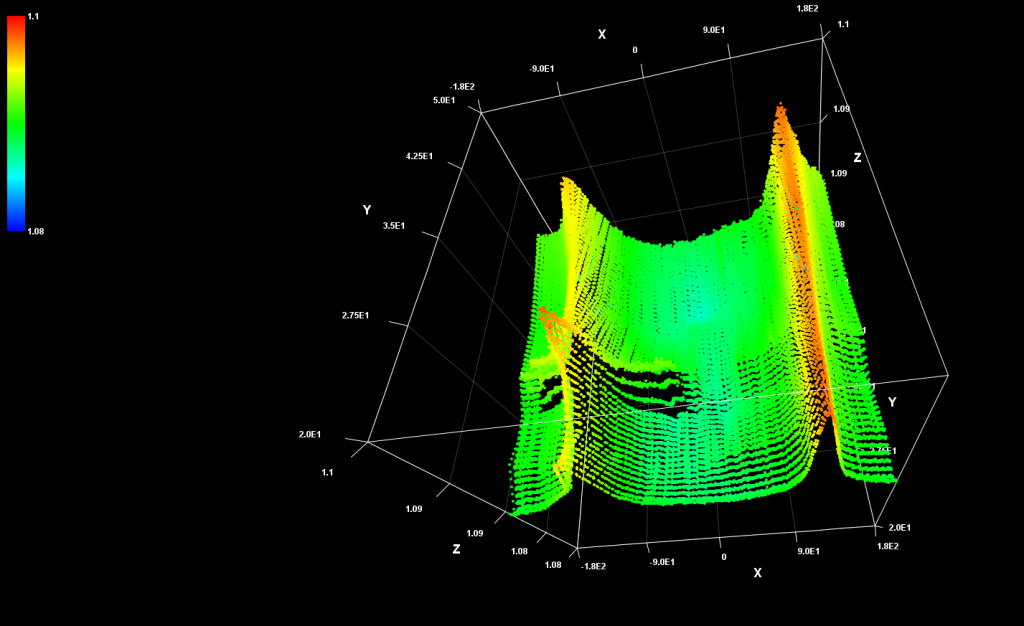
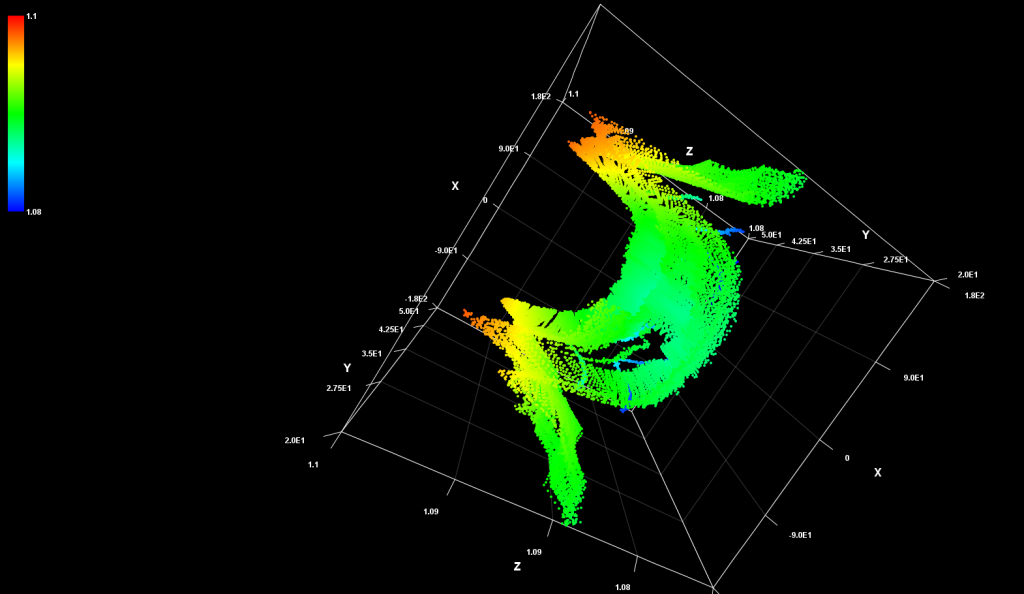
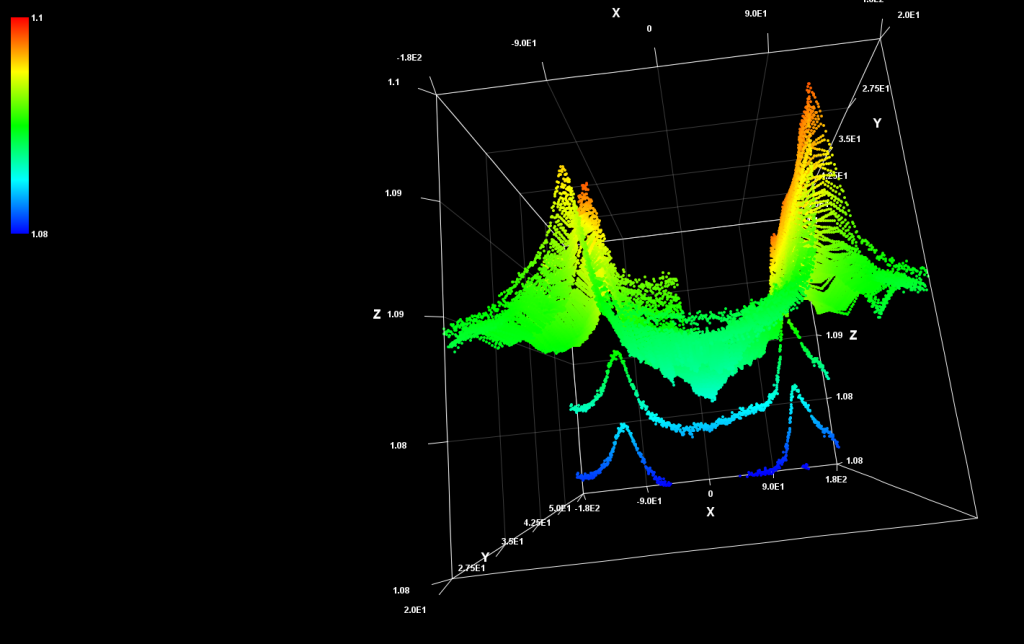
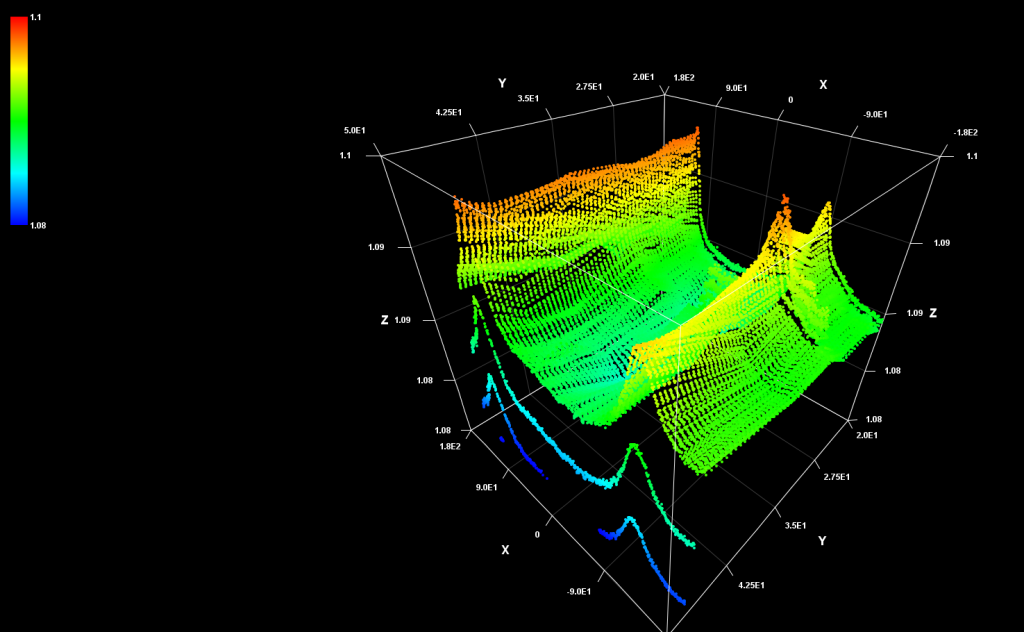
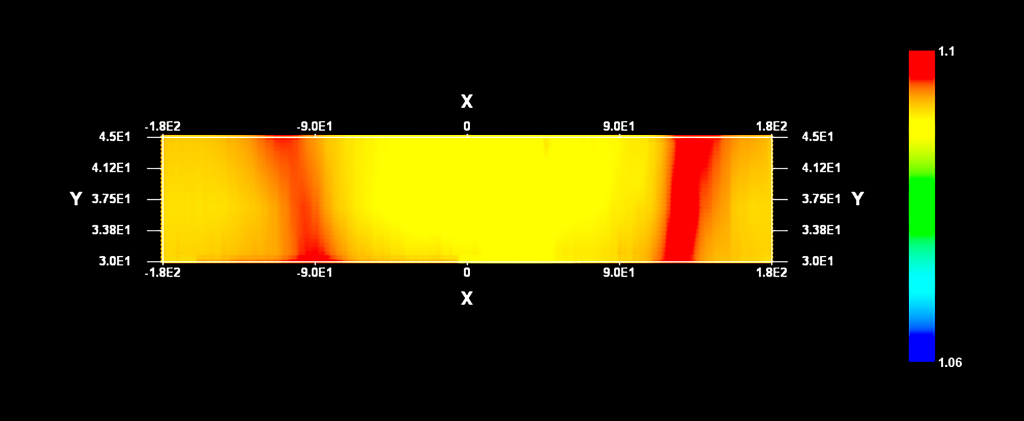
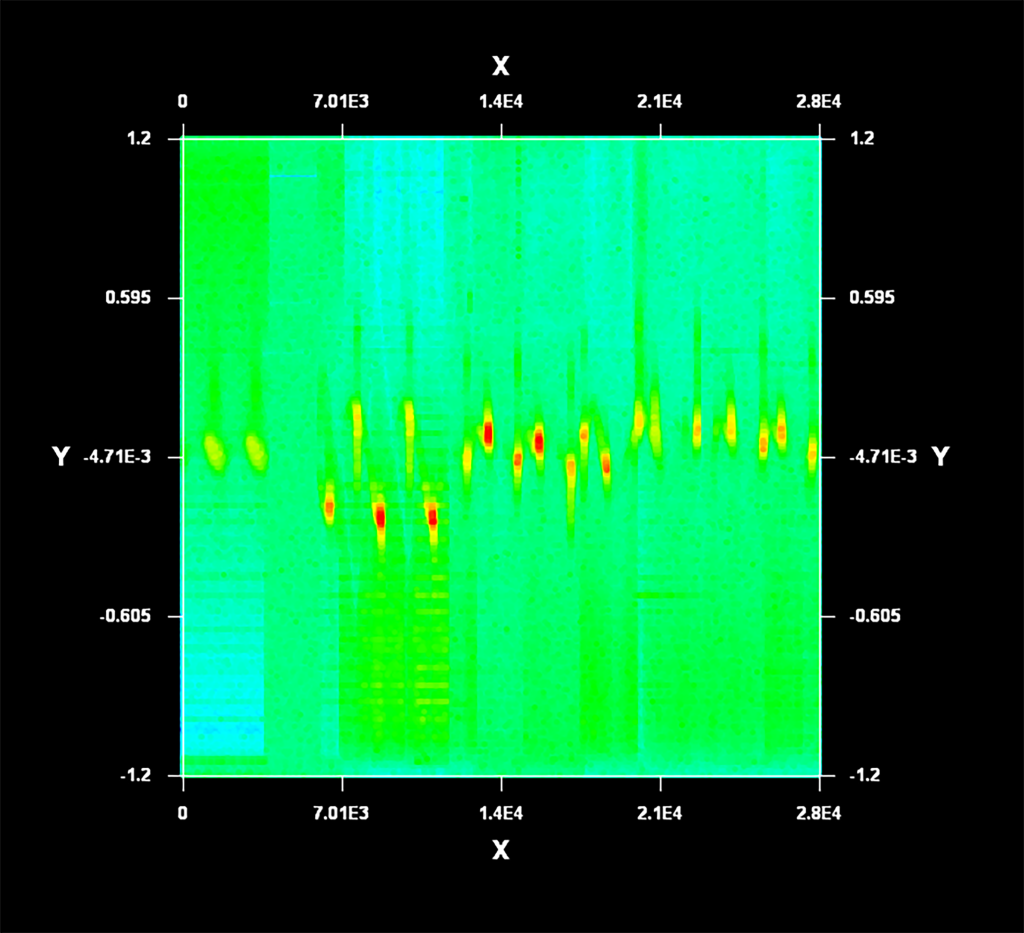
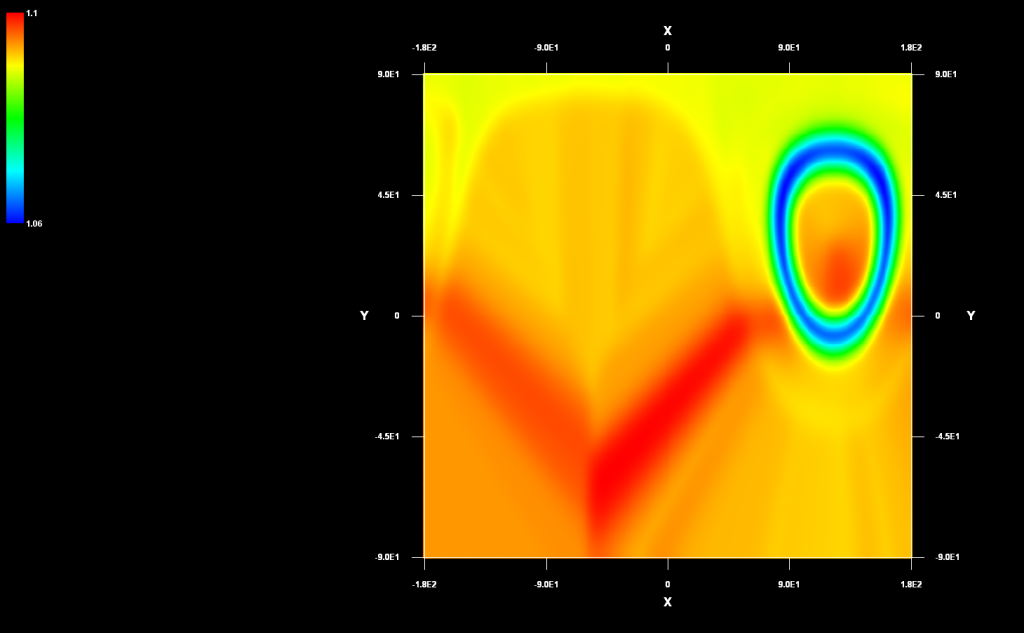
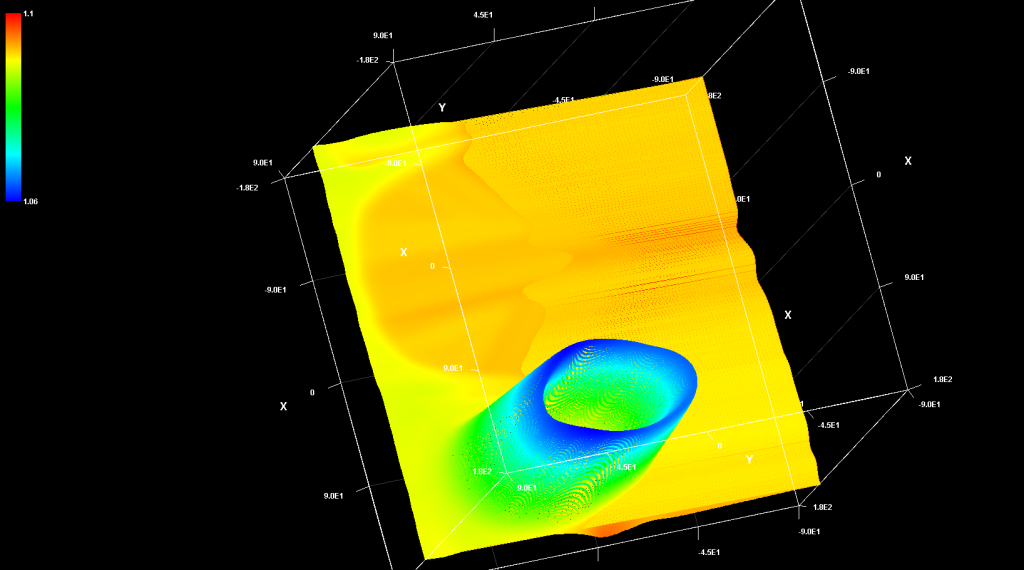
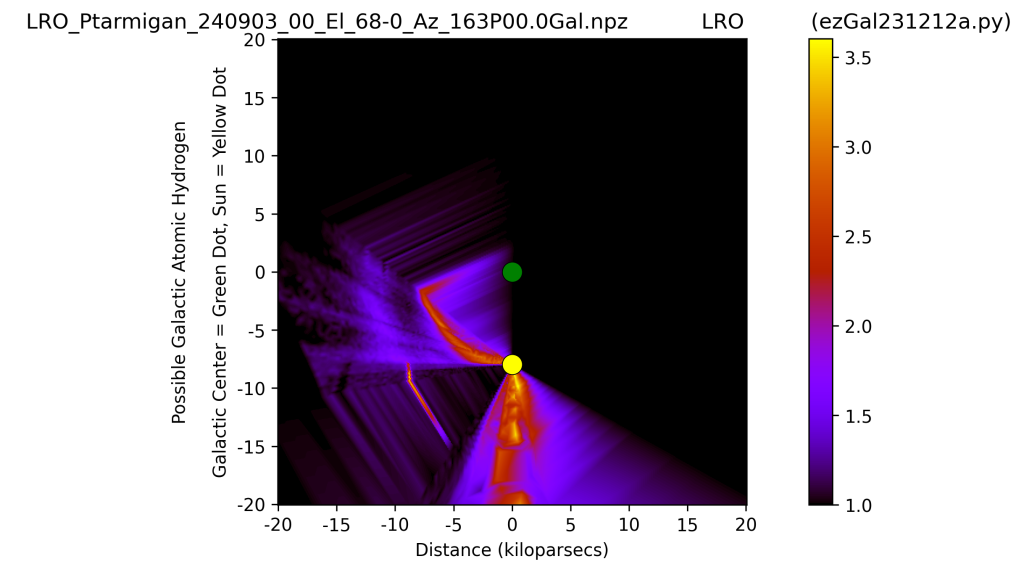
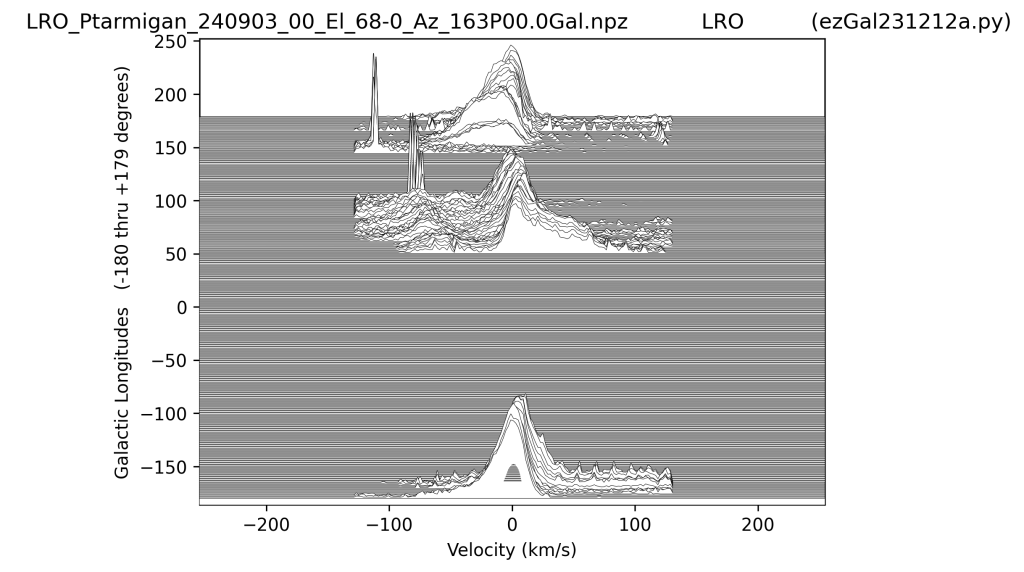
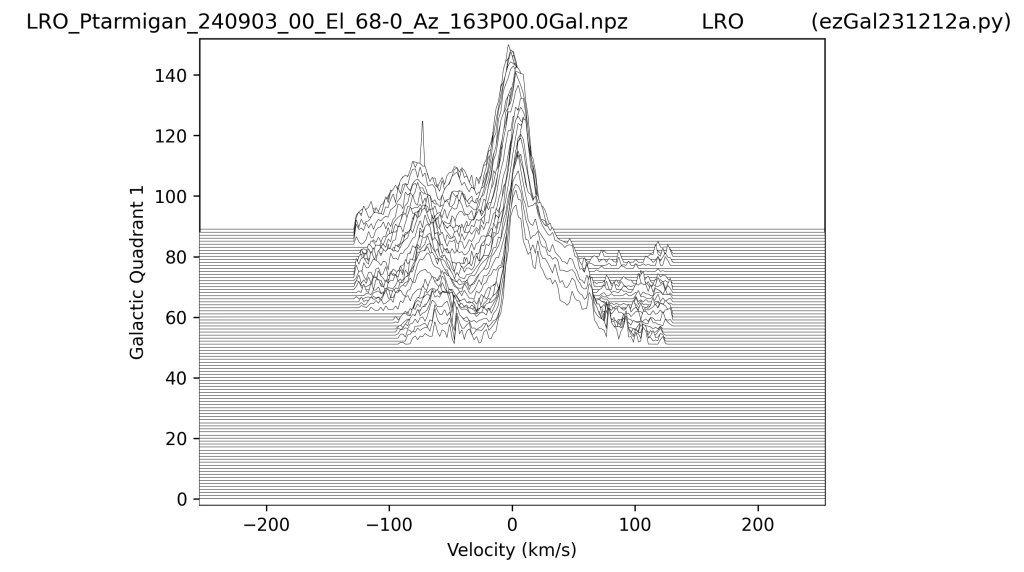
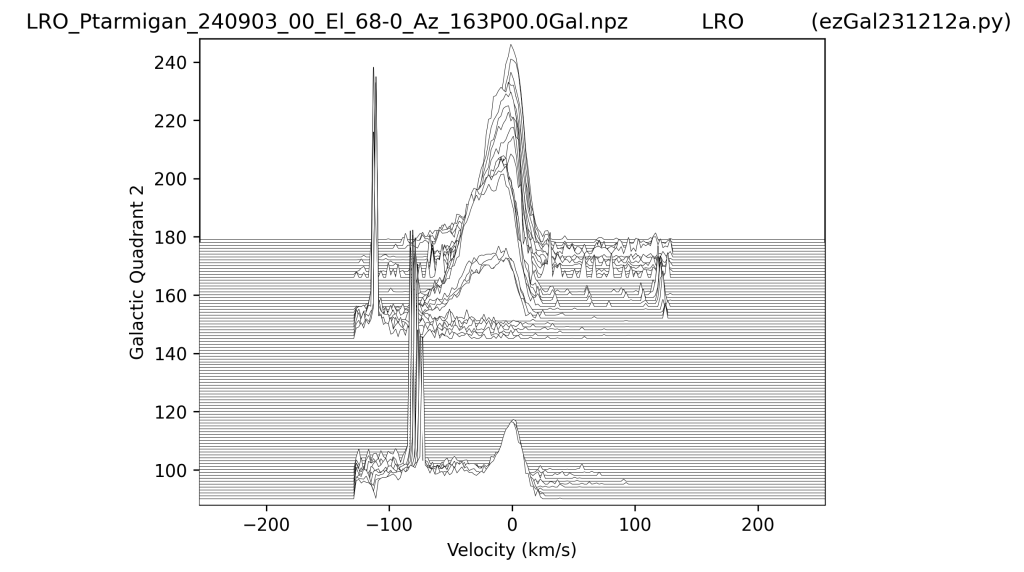
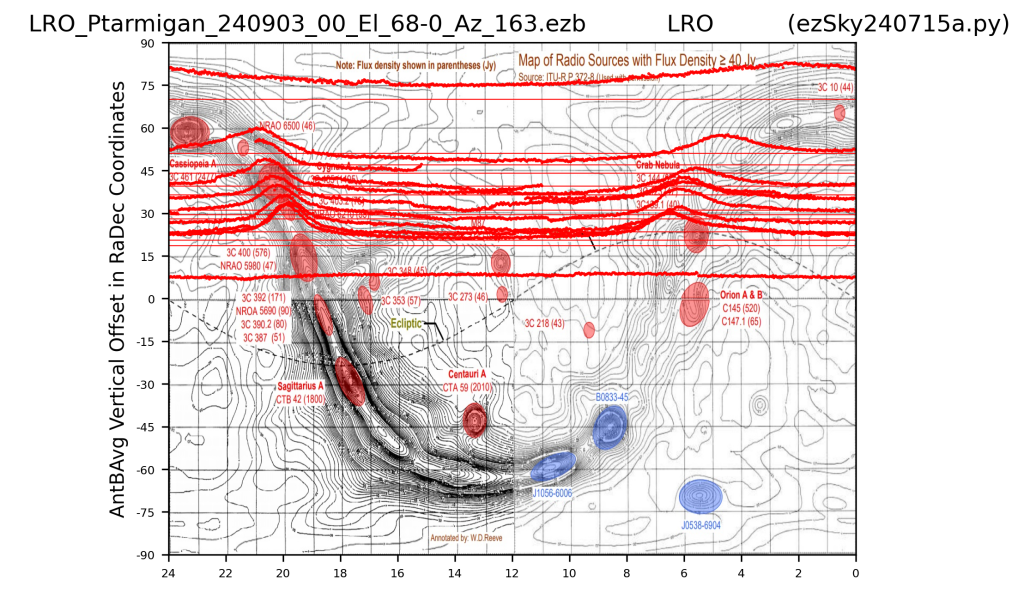
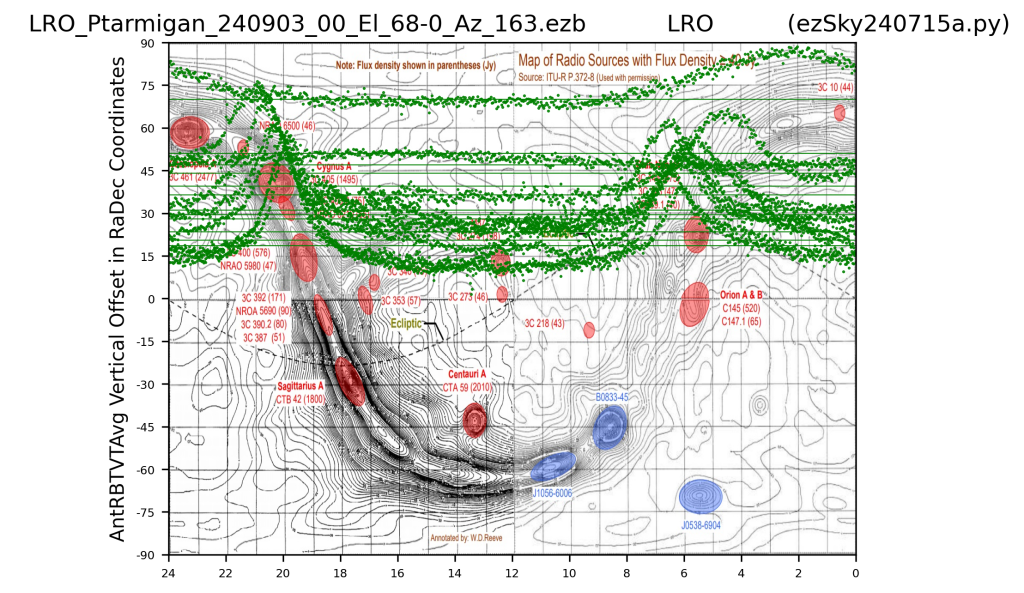
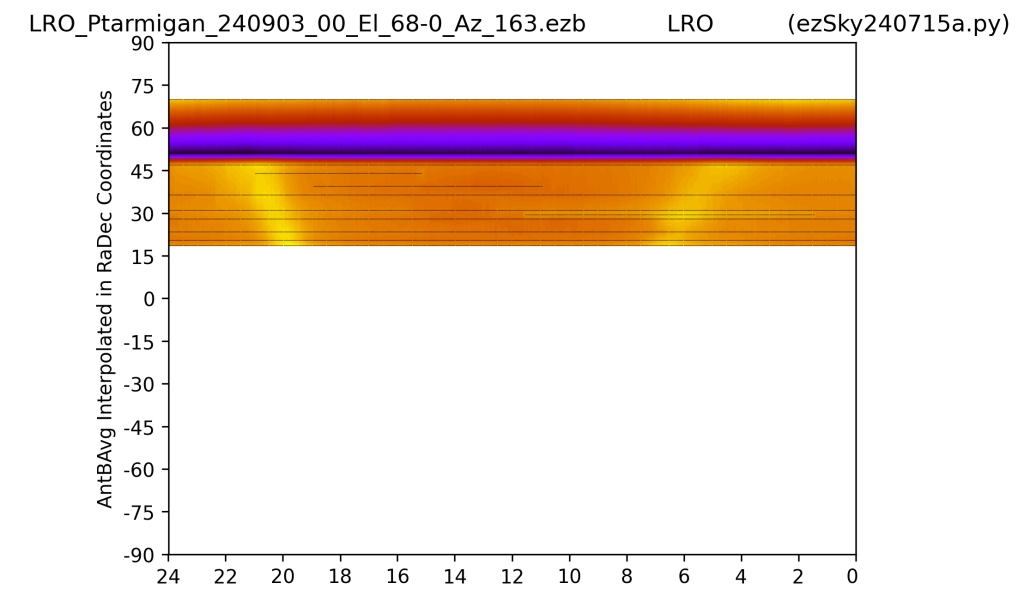
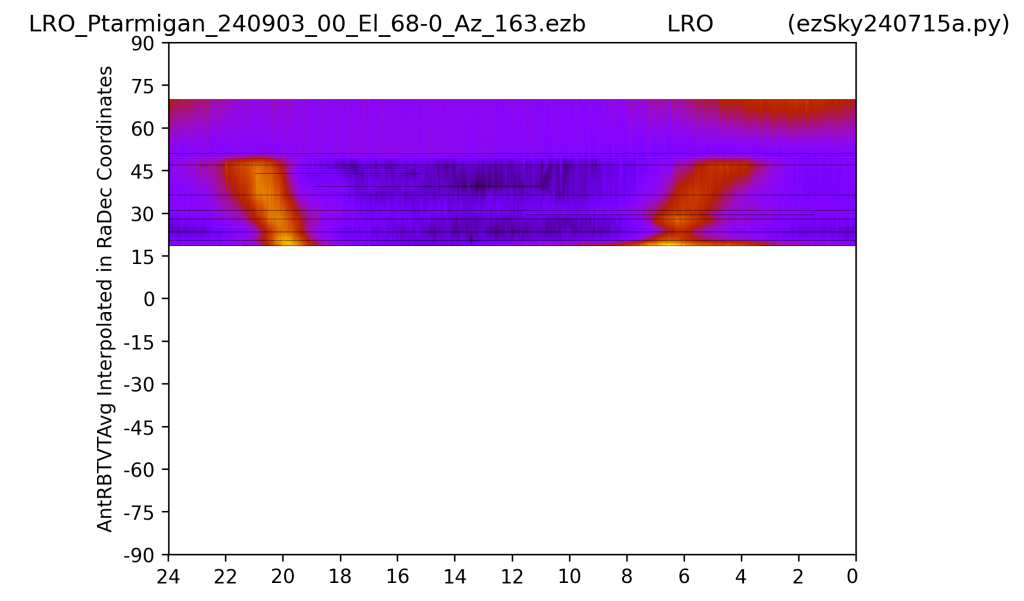
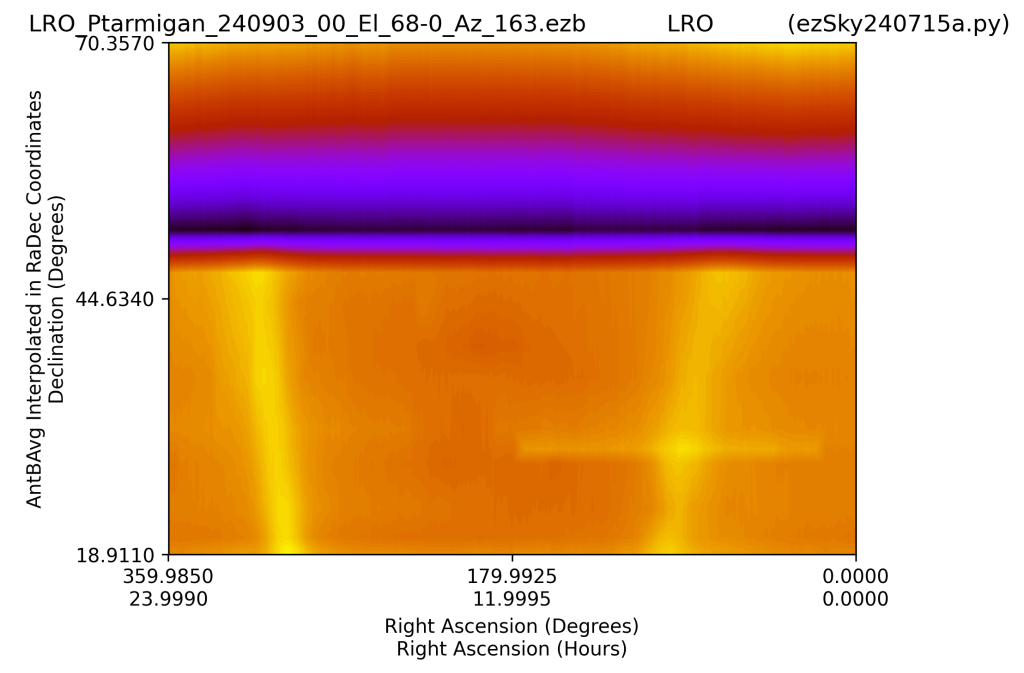
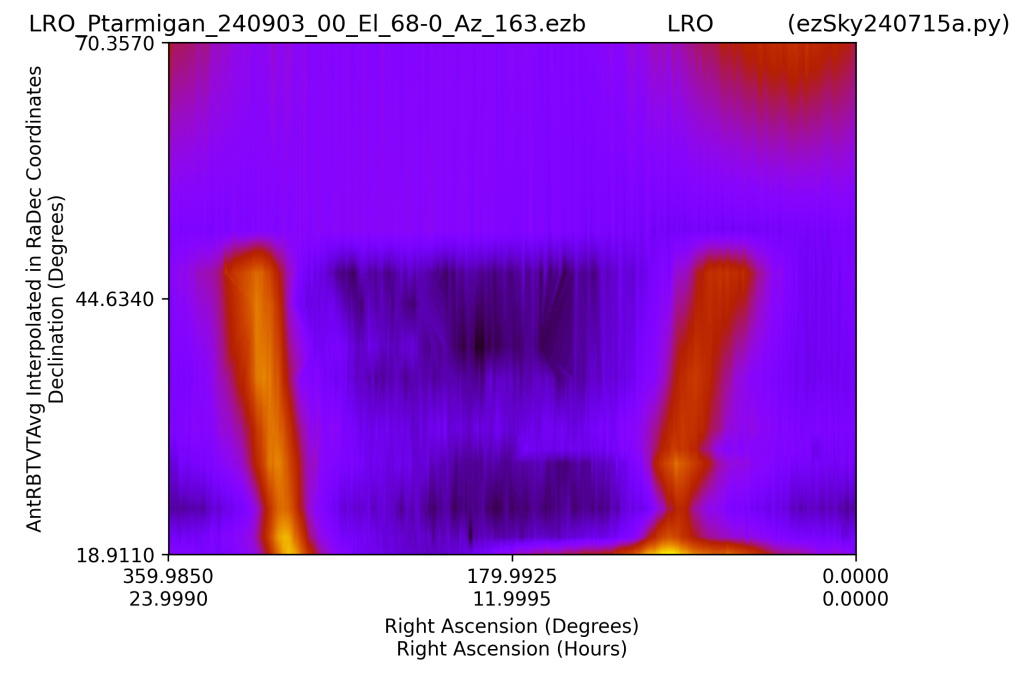
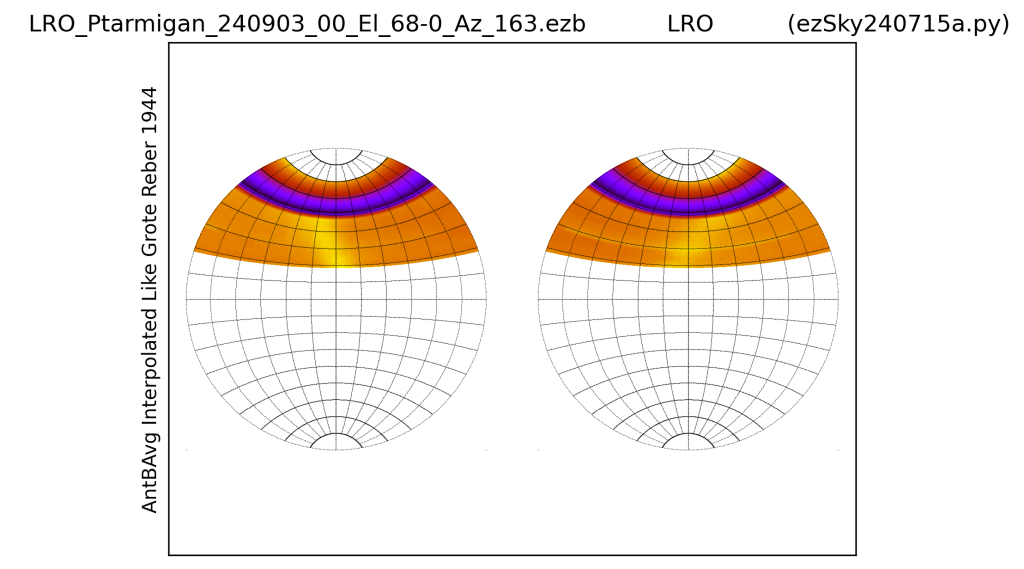
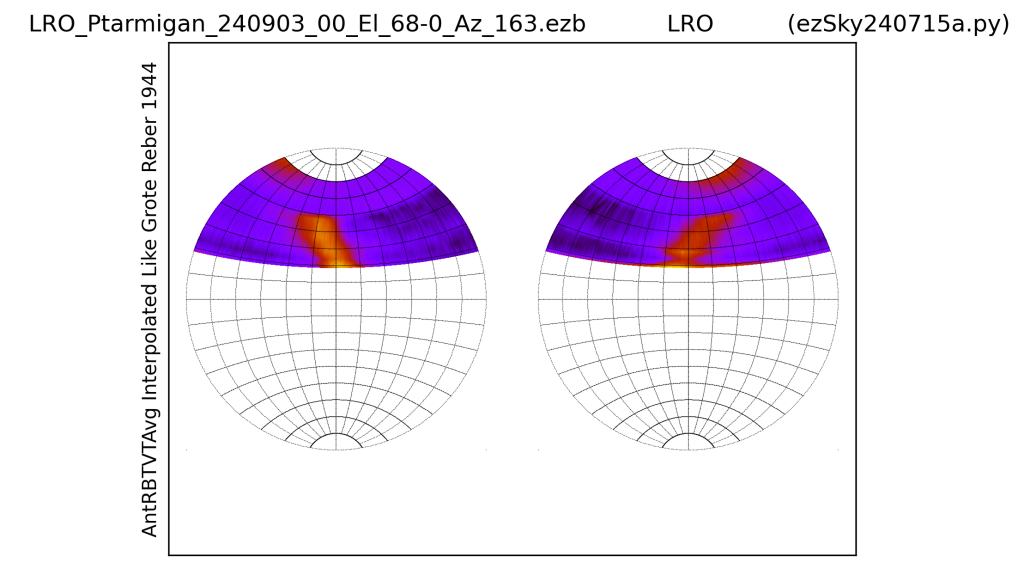
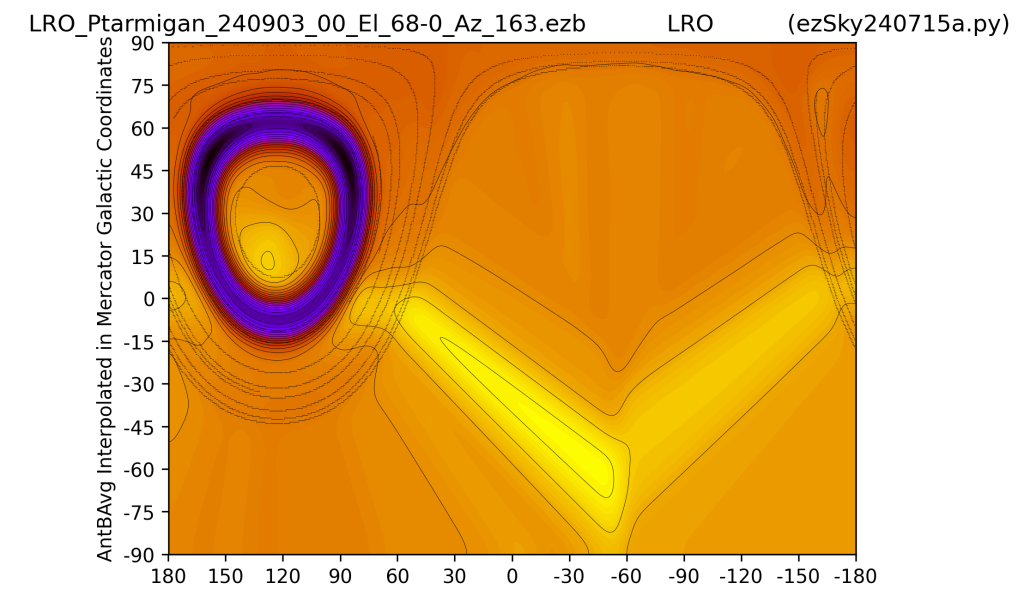
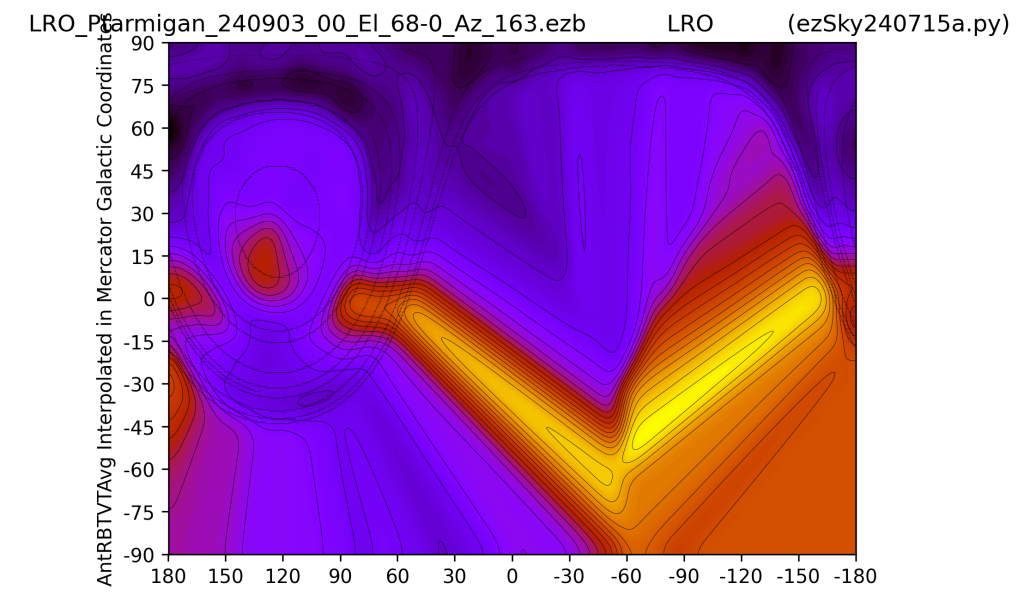
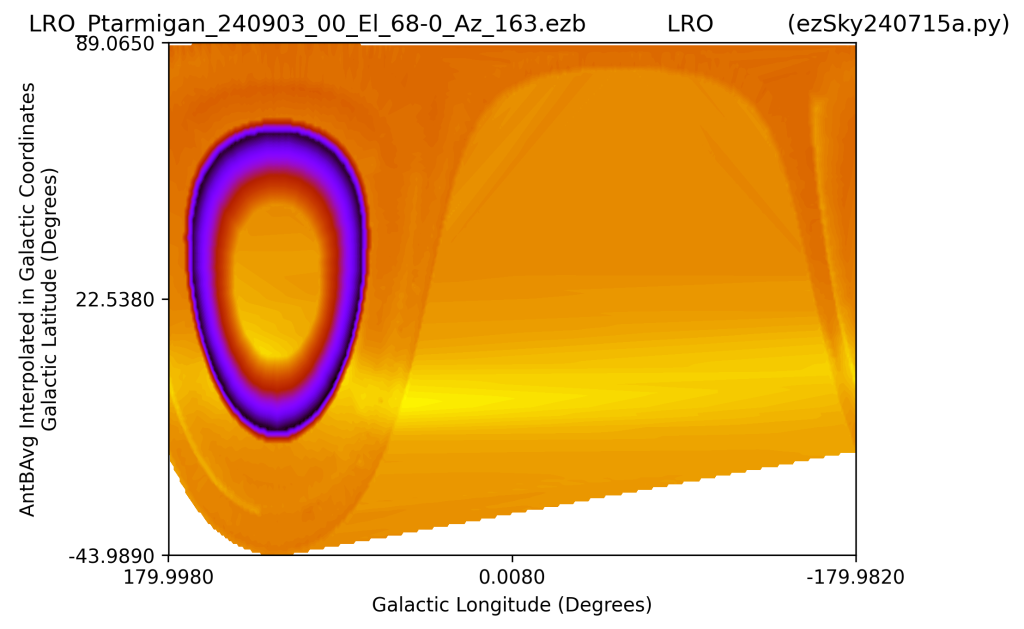
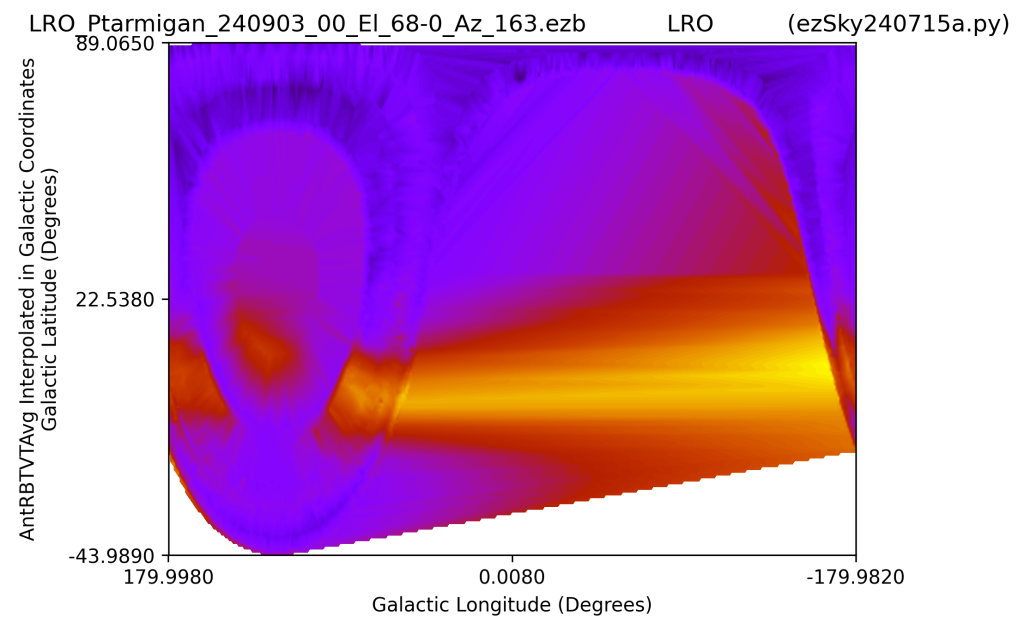
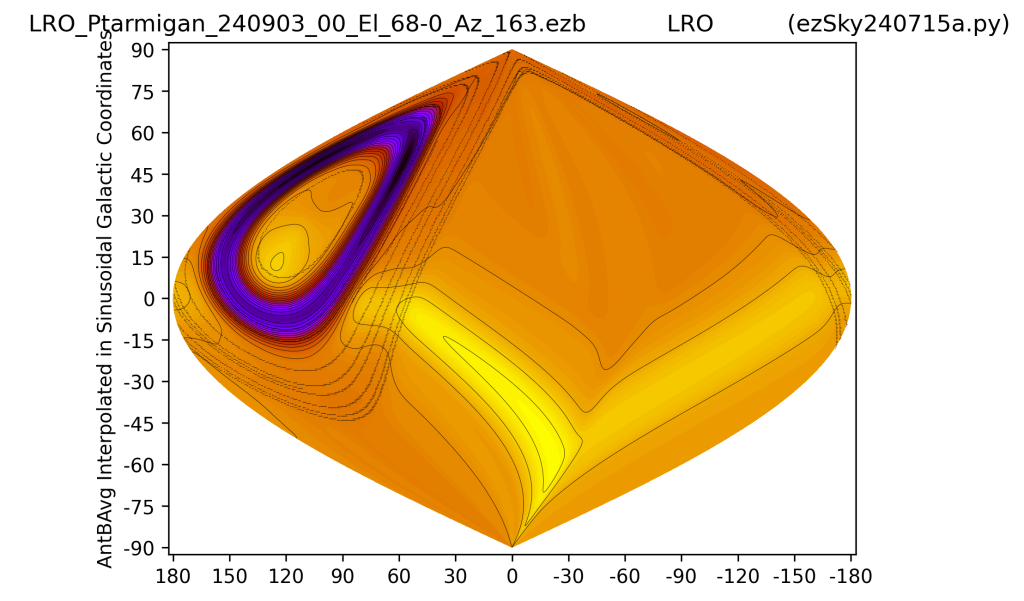
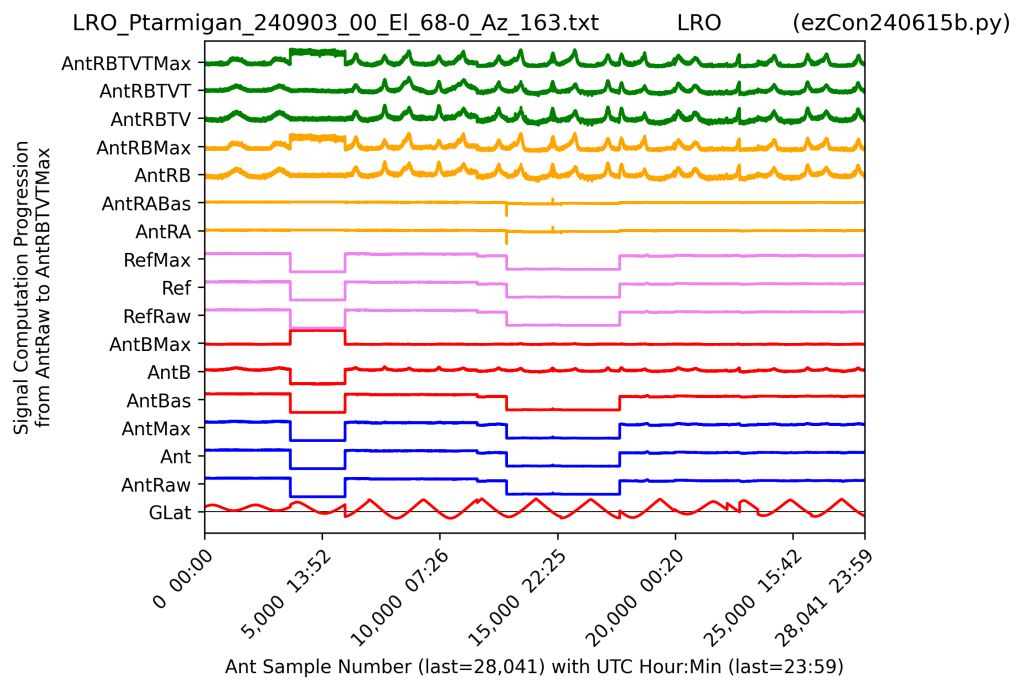
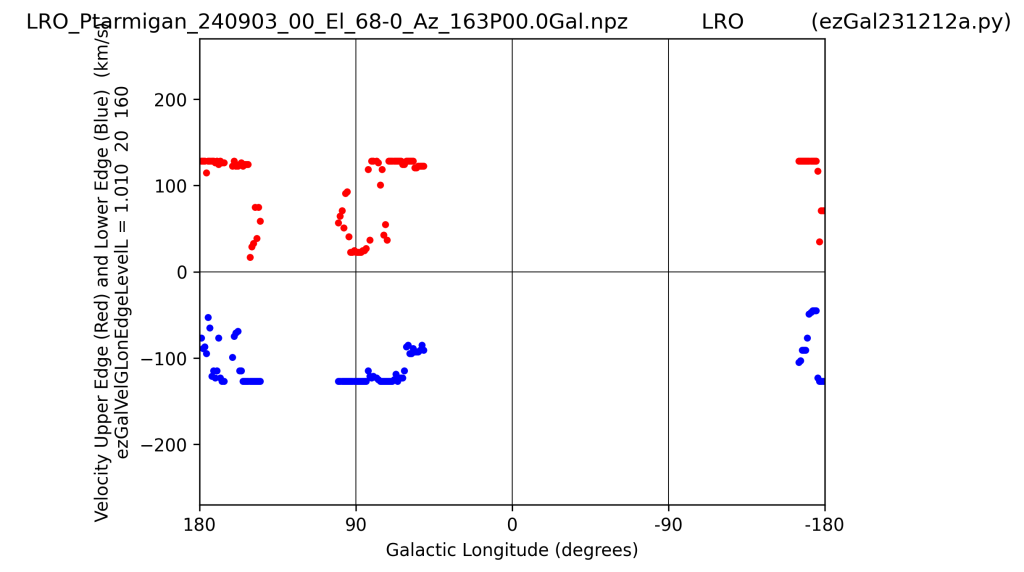
Below I followed Ted Cline’s new instruction set on how to generate 3D plots from ezRA data sets – 3D here means 2 distance dimensions and 3rd dimension is intensity of signal.
![](https://i0.wp.com/www.astronomy.me.uk/wp-content/uploads/2024/12/Plot-3D-071224%401300I.png?resize=800%2C489&ssl=1)
![](https://i0.wp.com/www.astronomy.me.uk/wp-content/uploads/2024/12/Plot-3D-071224%401300II.png?resize=800%2C464&ssl=1)
![](https://i0.wp.com/www.astronomy.me.uk/wp-content/uploads/2024/12/Plot-3D-071224%401300III.png?resize=800%2C503&ssl=1)
![](https://i0.wp.com/www.astronomy.me.uk/wp-content/uploads/2024/12/Plot-3D-071224%401300IV.png?resize=800%2C494&ssl=1)
![](https://i0.wp.com/www.astronomy.me.uk/wp-content/uploads/2024/12/Plot-3D-071224%401300V.png?resize=800%2C329&ssl=1)
![](https://i0.wp.com/www.astronomy.me.uk/wp-content/uploads/2024/12/Plot-3D-071224%401300VI.png?resize=800%2C729&ssl=1)
![](https://i0.wp.com/www.astronomy.me.uk/wp-content/uploads/2024/12/Plot-3D-071224%401300VII.png?resize=800%2C495&ssl=1)
![](https://i0.wp.com/www.astronomy.me.uk/wp-content/uploads/2024/12/Plot-3D-071224%401300VIII.png?resize=800%2C445&ssl=1)
![](https://i0.wp.com/www.astronomy.me.uk/wp-content/uploads/2024/12/ezCon191sigProg-1.png?resize=800%2C539&ssl=1)
![](https://i0.wp.com/www.astronomy.me.uk/wp-content/uploads/2024/12/ezCon510velGLon-1.png?resize=800%2C493&ssl=1)
![](https://i0.wp.com/www.astronomy.me.uk/wp-content/uploads/2024/12/ezCon541velGLonEdges-1.png?resize=800%2C493&ssl=1)
![](https://i0.wp.com/www.astronomy.me.uk/wp-content/uploads/2024/12/ezGal540velGLonEdgesB_1.0100-1.png?resize=800%2C447&ssl=1)
![](https://i0.wp.com/www.astronomy.me.uk/wp-content/uploads/2024/12/ezGal541velGLonEdges_1.0100-1.png?resize=800%2C447&ssl=1)
![](https://i0.wp.com/www.astronomy.me.uk/wp-content/uploads/2024/12/ezGal550galRot_1.0100.png?resize=800%2C447&ssl=1)
![](https://i0.wp.com/www.astronomy.me.uk/wp-content/uploads/2024/12/ezGal560galMass_1.0100-1.png?resize=800%2C462&ssl=1)
![](https://i0.wp.com/www.astronomy.me.uk/wp-content/uploads/2024/12/ezGal570galArmsSun-1.png?resize=800%2C456&ssl=1)
![](https://i0.wp.com/www.astronomy.me.uk/wp-content/uploads/2024/12/ezGal580galArmsGC-1.png?resize=800%2C447&ssl=1)
![](https://i0.wp.com/www.astronomy.me.uk/wp-content/uploads/2024/12/ezGal610gLonSpectraCascade-1.png?resize=800%2C447&ssl=1)
![](https://i0.wp.com/www.astronomy.me.uk/wp-content/uploads/2024/12/ezGal611gLonSpectraCascade-1.png?resize=800%2C447&ssl=1)
![](https://i0.wp.com/www.astronomy.me.uk/wp-content/uploads/2024/12/ezGal612gLonSpectraCascade-1.png?resize=800%2C447&ssl=1)
![](https://i0.wp.com/www.astronomy.me.uk/wp-content/uploads/2024/12/ezGal613gLonSpectraCascade.png?resize=800%2C447&ssl=1)
![](https://i0.wp.com/www.astronomy.me.uk/wp-content/uploads/2024/12/ezSky200RBVO_14AntBAvg-1.png?resize=800%2C463&ssl=1)
![](https://i0.wp.com/www.astronomy.me.uk/wp-content/uploads/2024/12/ezSky200RBVO_18AntRBTVTAvg-1.png?resize=800%2C463&ssl=1)
![](https://i0.wp.com/www.astronomy.me.uk/wp-content/uploads/2024/12/ezSky400RI_14AntBAvg.png?resize=800%2C470&ssl=1)
![](https://i0.wp.com/www.astronomy.me.uk/wp-content/uploads/2024/12/ezSky400RI_18AntRBTVTAvg.png?resize=800%2C470&ssl=1)
![](https://i0.wp.com/www.astronomy.me.uk/wp-content/uploads/2024/12/ezSky405RIL_14AntBAvg.png?resize=800%2C526&ssl=1)
![](https://i0.wp.com/www.astronomy.me.uk/wp-content/uploads/2024/12/ezSky405RIL_18AntRBTVTAvg.png?resize=800%2C526&ssl=1)
![](https://i0.wp.com/www.astronomy.me.uk/wp-content/uploads/2024/12/ezSky450RIR_14AntBAvg.png?resize=800%2C445&ssl=1)
![](https://i0.wp.com/www.astronomy.me.uk/wp-content/uploads/2024/12/ezSky450RIR_18AntRBTVTAvg.png?resize=800%2C445&ssl=1)
![](https://i0.wp.com/www.astronomy.me.uk/wp-content/uploads/2024/12/ezSky500GMI_14AntBAvg.png?resize=800%2C470&ssl=1)
![](https://i0.wp.com/www.astronomy.me.uk/wp-content/uploads/2024/12/ezSky500GMI_18AntRBTVTAvg.png?resize=800%2C470&ssl=1)
![](https://i0.wp.com/www.astronomy.me.uk/wp-content/uploads/2024/12/ezSky505GMIL_14AntBAvg.png?resize=800%2C491&ssl=1)
![](https://i0.wp.com/www.astronomy.me.uk/wp-content/uploads/2024/12/ezSky505GMIL_18AntRBTVTAvg.png?resize=800%2C491&ssl=1)
![](https://i0.wp.com/www.astronomy.me.uk/wp-content/uploads/2024/12/ezSky510GSI_14AntBAvg-1.png?resize=800%2C470&ssl=1)
![](https://i0.wp.com/www.astronomy.me.uk/wp-content/uploads/2024/12/ezSky510GSI_18AntRBTVTAvg.png?resize=800%2C470&ssl=1)
![](https://i0.wp.com/www.astronomy.me.uk/wp-content/uploads/2024/12/ezSky520GOI_14AntBAvg-1.png?resize=800%2C470&ssl=1)
![](https://i0.wp.com/www.astronomy.me.uk/wp-content/uploads/2024/12/ezSky520GOI_18AntRBTVTAvg.png?resize=800%2C470&ssl=1)
I love these plots- which set of instructions from Ted Cline specifically are you referring to? I have been gathering some 1420 MHz data and would like to try this.