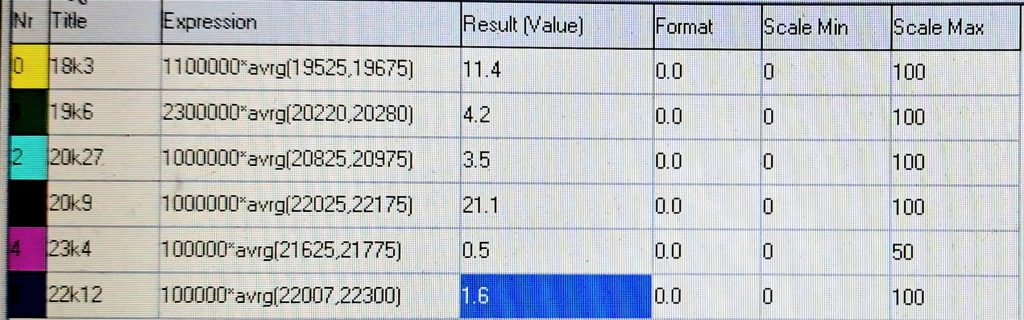
Settings on plotter in Spectrum Lab software – the title is the frequency of the VLF transmitter observed in kHz:
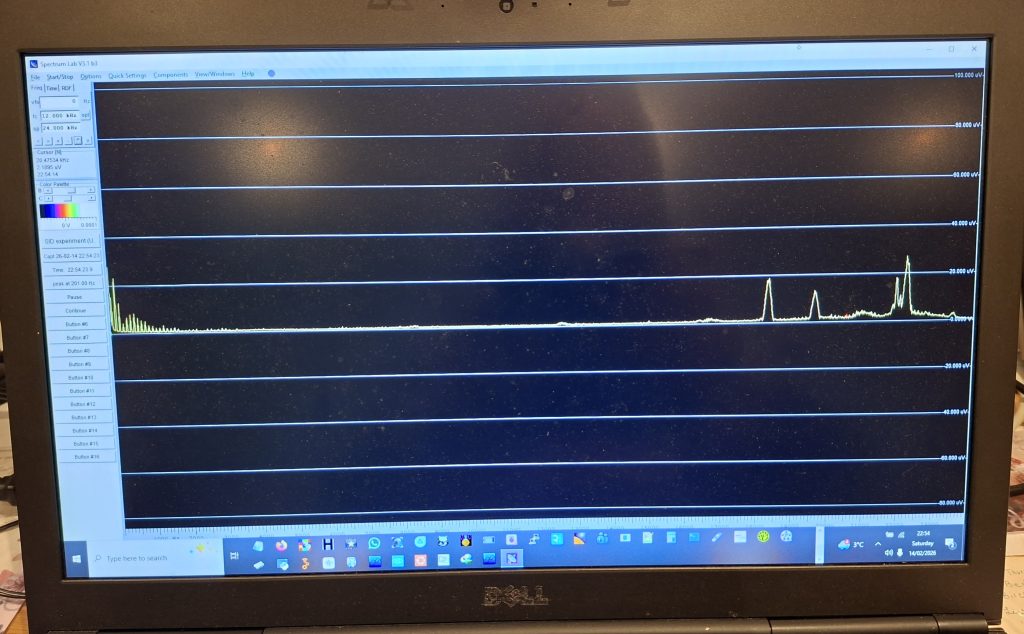
Plot from first light at LRO on Spectrum Lab – each peak represents a different VLF transmitter. 23.4 kHz is at far right. Horizontal axis is frequency from 0Hz on left to 25 kHz on right, and vertical axis is voltage (amplitude of signal).
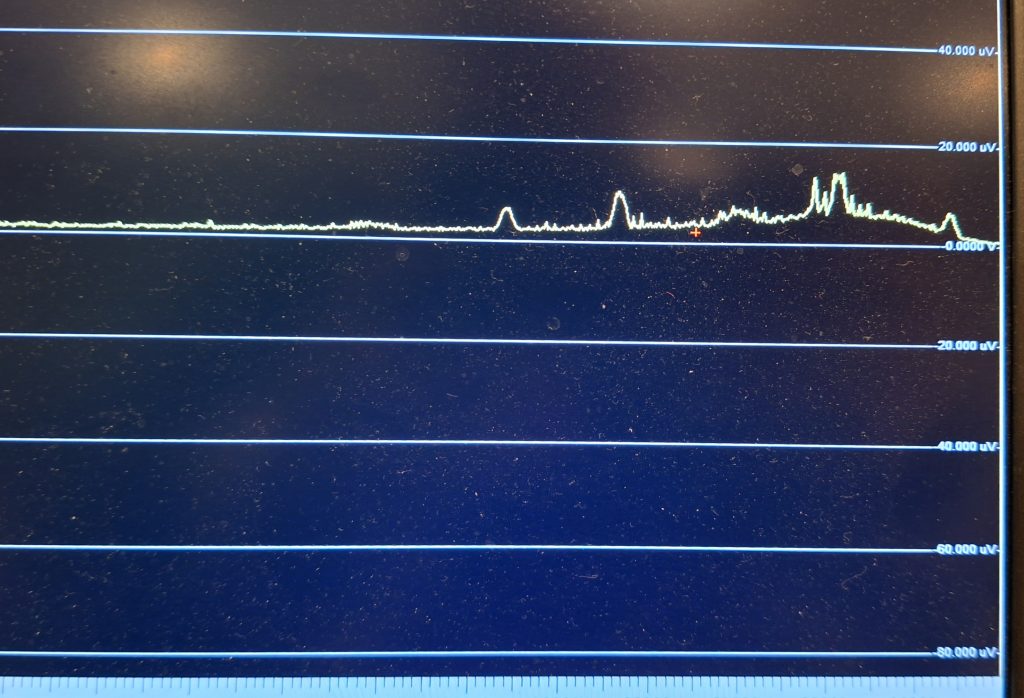
Close up of plot:
Whole Plot:
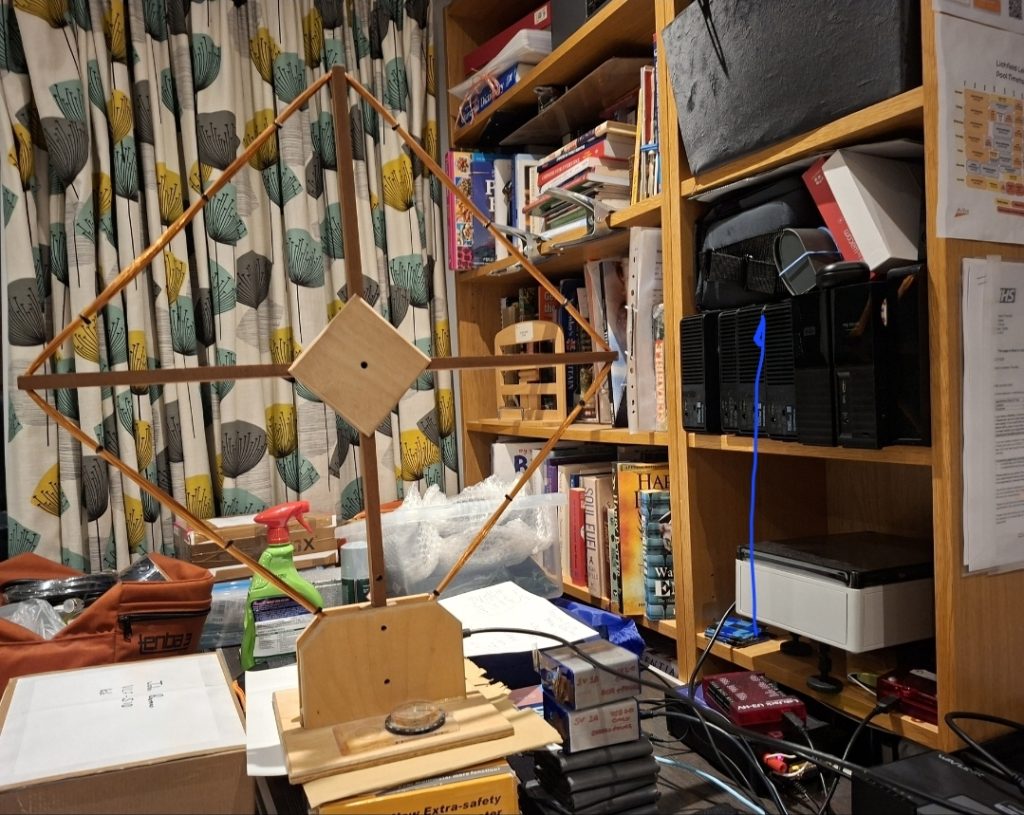
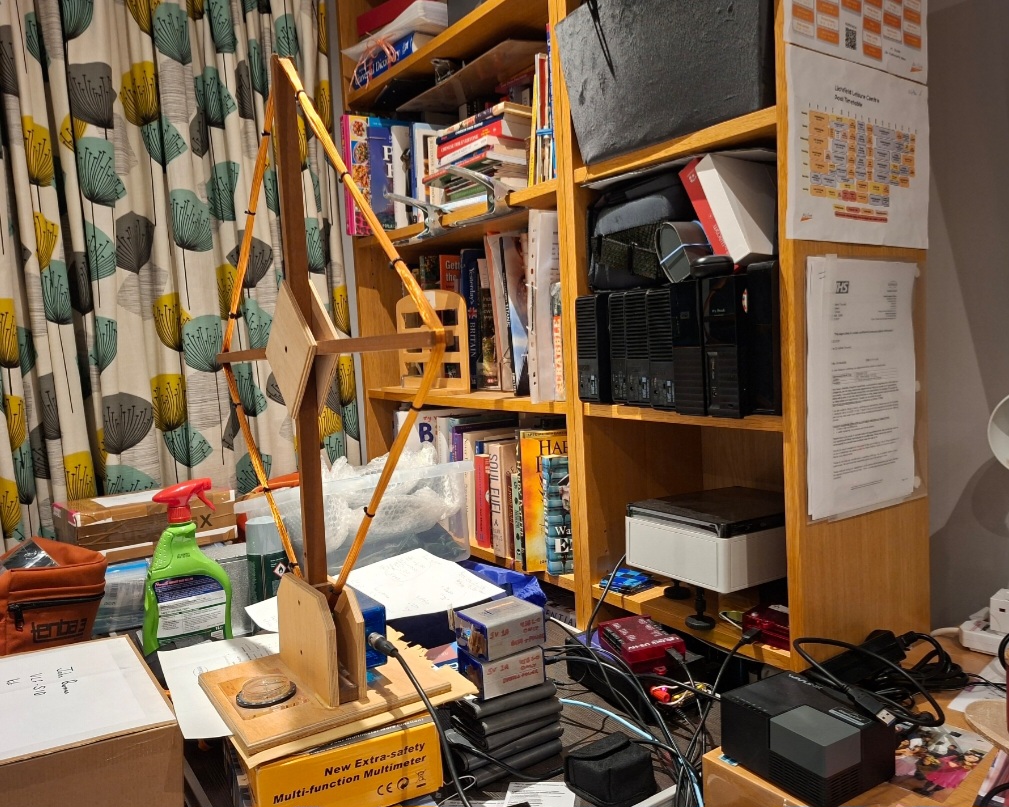
Best direction in my study for 23.4 kHz (parallel to bookcase):
Best direction for other VLF transmissions (orthogonal to bookcase in study):